ICT Immediate Rebalance [LuxAlgo]The ICT Immediate Rebalance aims at detecting and highlighting immediate rebalances, a concept taught by Inner Circle Trader. The ICT Immediate Rebalance, although frequently overlooked, emerges as one of ICT's most influential concepts, particularly when considered within a specific context.
🔶 USAGE
Immediate rebalances, a concept taught by ICT, hold significant importance in decision-making. To comprehend the concept of immediate rebalance, it's essential to grasp the notion of the fair value gap. A fair value gap arises from market inefficiencies or imbalances, whereas an immediate rebalance leaves no gap, no inefficiencies, or no imbalances that the price would need to return to.
Following an immediate rebalance, the typical expectation is for two extension candles to ensue; failing this, the immediate rebalance is deemed unsuccessful. It's important to note that both failed and successful immediate rebalances hold significance in trading when analyzed within a contextual framework.
Immediate rebalances can manifest across various locations and timeframes. It's recommended to analyze them in conjunction with other ICT tools or technical indicators to gain a more comprehensive understanding of market dynamics.
🔹 Multi Timeframe
The script facilitates multi-timeframe analysis, enabling users to display immediate rebalances from higher timeframes.
Enabling the display of higher timeframe candles helps visualize the detected immediate rebalance patterns.
🔹 Dashboard
The dashboard offers statistical insights into immediate rebalances.
🔶 SETTINGS
🔹 Immediate Rebalances
Timeframe: this option is to identify immediate rebalances from higher timeframes. If a timeframe lower than the chart's timeframe is selected, calculations will be based on the chart's timeframe.
Bullish, and Bearish Immediate Rebalances: color customization options.
Wicks 75%, %50, and %25: color customization options of the wick price levels for the detected immediate rebalances.
Immediate Rebalance Candles: toggles the visualization of higher timeframe candles where immediate rebalance is detected.
Confirmation (Bars): specifies the number of bars required to confirm the validation of the detected immediate rebalance.
Immediate Rebalance Icon: allows customization of the size of the icon used to represent the immediate rebalance.
🔹 Dashboard
Dashboard: toggles the visualization of the dashboard, sets its location, and customizes the size of the dashboard.
🔶 RELATED SCRIPTS
Fair-Value-Gap
Thanks to our community for recommending this script. For more conceptual scripts and related content, we welcome you to explore by visiting >>> LuxAlgo-Scripts .
Search in scripts for "the script"

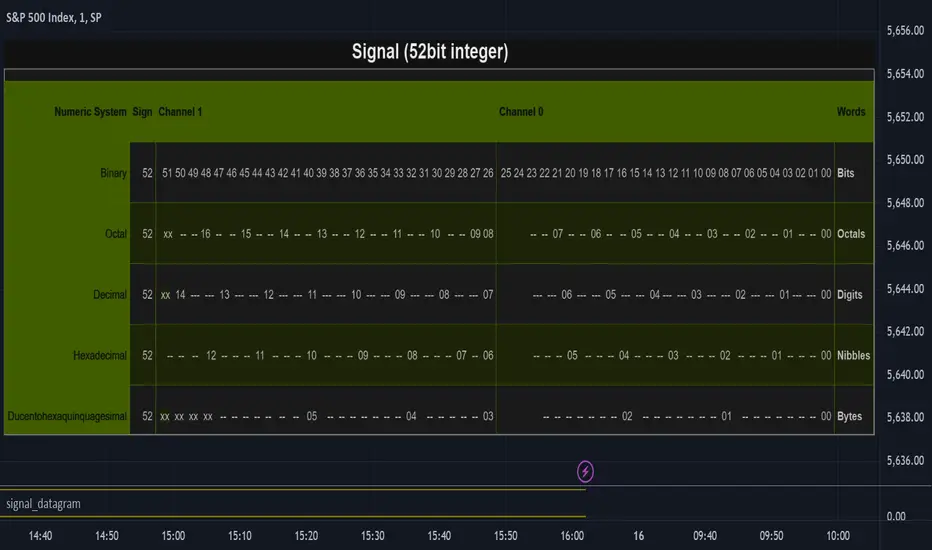
signal_datagramThe purpose of this library is to split and merge an integer into useful pieces of information that can easily handled and plotted.
The basic piece of information is one word. Depending on the underlying numerical system a word can be a bit, octal, digit, nibble, or byte.
The user can define channels. Channels are named groups of words. Multiple words can be combined to increase the value range of a channel.
A datagram is a description of the user-defined channels in an also user-defined numeric system that also contains all runtime information that is necessary to split and merge the integer.
This library simplifies the communication between two scripts by allowing the user to define the same datagram in both scripts.
On the sender's side, the channel values can be merged into one single integer value called signal. This signal can be 'emitted' using the plot function. The other script can use the 'input.source' function to receive that signal.
On the receiver's end based on the same datagram, the signal can be split into several channels. Each channel has the piece of information that the sender script put.
In the example of this library, we use two channels and we have split the integer in half. However, the user can add new channels, change them, and give meaning to them according to the functionality he wants to implement and the type of information he wants to communicate.
Nowadays many 'input.source' calls are allowed to pass information between the scripts, When that is not a price or a floating value, this library is very useful.
The reason is that most of the time, the convention that is used is not clear enough and it is easy to do things the wrong way or break them later on.
With this library validation checks are done during the initialization minimizing the possibility of error due to some misconceptions.
Library "signal_datagram"
Conversion of a datagram type to a signal that can be "send" as a single value from an indicator to a strategy script
method init(this, positions, maxWords)
init - Initialize if the word positons array with an empty array
Namespace types: WordPosArray
Parameters:
this (WordPosArray) : - The word positions array object
positions (int ) : - The array that contains all the positions of the worlds that shape the channel
maxWords (int) : - The maximum words allowed based on the span
Returns: The initialized object
method init(this)
init - Initialize if the channels word positons map with an empty map
Namespace types: ChannelDesc
Parameters:
this (ChannelDesc) : - The channels' descriptor object
Returns: The initialized object
method init(this, numericSystem, channelDesc)
init - Initialize if the datagram
Namespace types: Datagram
Parameters:
this (Datagram) : - The datagram object
numericSystem (simple string) : - The numeric system of the words to be used
channelDesc (ChannelDesc) : - The channels descriptor that contains the positions of the words that each channel consists of
Returns: The initialized object
method add_channel(this, name, positions)
add_channel - Add a new channel descriptopn with its name and its corresponding word positons to the map
Namespace types: ChannelDesc
Parameters:
this (ChannelDesc) : - The channels' descriptor object to update
name (simple string)
positions (int )
Returns: The initialized object
method set_signal(this, value)
set_signal - Set the signal value
Namespace types: Datagram
Parameters:
this (Datagram) : - The datagram object to update
value (int) : - The signal value to set
method get_signal(this)
get_signal - Get the signal value
Namespace types: Datagram
Parameters:
this (Datagram) : - The datagram object to query
Returns: The value of the signal in digits
method set_signal_sign(this, sign)
set_signal_sign - Set the signal sign
Namespace types: Datagram
Parameters:
this (Datagram) : - The datagram object to update
sign (int) : - The negative -1 or positive 1 sign of the underlying value
method get_signal_sign(this)
get_signal_sign - Get the signal sign
Namespace types: Datagram
Parameters:
this (Datagram) : - The datagram object to query
Returns: The sign of the signal value -1 if it is negative and 1 if it is possitive
method get_channel_names(this)
get_channel_names - Get an array of all channel names
Namespace types: Datagram
Parameters:
this (Datagram)
Returns: An array that has all the channel names that are used by the datagram
method set_channel_value(this, channelName, value)
set_channel_value - Set the value of the channel
Namespace types: Datagram
Parameters:
this (Datagram) : - The datagram object to update
channelName (simple string) : - The name of the channel to set the value to. Then name should be as described int the schemas channel descriptor
value (int) : - The channel value to set
method set_all_channels_value(this, value)
set_all_channels_value - Set the value of all the channels
Namespace types: Datagram
Parameters:
this (Datagram) : - The datagram object to update
value (int) : - The channel value to set
method set_all_channels_max_value(this)
set_all_channels_value - Set the value of all the channels
Namespace types: Datagram
Parameters:
this (Datagram) : - The datagram object to update
method get_channel_value(this, channelName)
get_channel_value - Get the value of the channel
Namespace types: Datagram
Parameters:
this (Datagram) : - The datagram object to query
channelName (simple string)
Returns: Digit group of words (bits/octals/digits/nibbles/hexes/bytes) found at the channel accodring to the schema
WordDesc
Fields:
numericSystem (series__string)
span (series__integer)
WordPosArray
Fields:
positions (array__integer)
ChannelDesc
Fields:
map (map__series__string:|WordPosArray|#OBJ)
Schema
Fields:
wordDesc (|WordDesc|#OBJ)
channelDesc (|ChannelDesc|#OBJ)
Signal
Fields:
value (series__integer)
isNegative (series__bool)
words (array__integer)
Datagram
Fields:
schema (|Schema|#OBJ)
signal (|Signal|#OBJ)
ZigZag█ OVERVIEW
This library is a Pine Script™ programmer’s tool containing custom user-defined types and functions to calculate Zig Zag indicators within their scripts. It is not a stand-alone indicator.
Pine Script™ libraries are publications that contain reusable code for importing into Pine Script™ indicators, strategies, and other libraries. For more information on libraries and incorporating them into your scripts, see the Libraries section of the Pine Script™ User Manual .
█ CONCEPTS
Zig Zag
Zig Zag is a popular indicator that filters out minor price fluctuations to denoise data and emphasize trends. Traders commonly use Zig Zag for trend confirmation, identifying potential support and resistance, and pattern detection. It is formed by identifying significant local high and low points in alternating order and connecting them with straight lines, omitting all other data points from their output. There are several ways to calculate the Zig Zag's data points and the conditions by which its direction changes. This script uses pivots as the data points, which are the highest or lowest values over a defined number of bars before and after them. The direction only reverses when a newly formed pivot deviates from the last Zig Zag point in the opposite direction by an amount greater than or equal to a specified percentage.
To learn more about Zig Zag and how to calculate it, see this entry from the Help Center.
█ FOR Pine Script™ CODERS
Notes
This script's architecture utilizes user-defined types (UDTs) to create custom objects which are the equivalent of variables containing multiple parts, each able to hold independent values of different types . UDTs are the newest addition to Pine Script™ and the most advanced feature the language has seen to date. The feature's introduction creates a new runway for experienced coders to push the boundaries of Pine. We recommend that newcomers to the language explore the basics first before diving into UDTs and objects.
Demonstration Code
Our example code shows a simple use case by displaying a Zig Zag with user-defined settings. A new ZigZag object is instantiated on the first bar using a Settings object to control its attributes. The fields for the Settings object are declared using variables assigned to input.* functions, allowing control of the field values from the script's settings. The `update()` function is invoked on each bar to update the ZigZag object's fields and create new lines and labels when required.
Look first. Then leap.
█ TYPES
This library contains the following types:
Settings
Provides calculation and display attributes to ZigZag objects.
Fields:
devThreshold : The minimum percentage deviation from a point before the ZigZag will change direction.
depth : The number of bars required for pivot detection.
lineColor : Line color.
extendLast : Condition allowing a line to connect the most recent pivot with the current close.
displayReversalPrice : Condition to display the pivot price in the pivot label.
displayCumulativeVolume : Condition to display the cumulative volume for the pivot segment in the pivot label.
displayReversalPriceChange : Condition to display the change in price or percent from the previous pivot in the pivot label.
differencePriceMode : Reversal change display mode. Options are "Absolute" or "Percent".
draw : Condition to display lines and labels.
Point
A coordinate containing time and price information.
Fields:
tm : A value in UNIX time.
price : A value on the Y axis (price).
Pivot
A level of significance used to determine directional movement or potential support and resistance.
Fields:
ln : A line object connecting the `start` and `end` Point objects.
lb : A label object to display pivot values.
isHigh : A condition to determine if the pivot is a pivot high.
vol : Volume for the pivot segment.
start : The coordinate of the previous Point.
end : The coordinate of the current Point.
ZigZag
An object to maintain Zig Zag settings, pivots, and volume.
Fields:
settings : Settings object to provide calculation and display attributes.
pivots : An array of Pivot objects.
sumVol : The volume sum for the pivot segment.
extend : Pivot object used to project a line from the last pivot to the last bar.
█ FUNCTIONS
This library contains the following functions:
lastPivot(this)
Returns the last Pivot of `this` ZigZag if there is at least one Pivot to return, and `na` otherwise.
Parameters:
this : (series ZigZag) A ZigZag object.
Returns: (Pivot) The last Pivot in the ZigZag.
update(this)
Updates `this` ZigZag object with new pivots, volume, lines, labels.
Parameters:
this : (series ZigZag) a ZigZag object.
Returns: (bool) true if a new Zig Zag line is found or the last Zig Zag line has changed.
newInstance(settings)
Instantiates a new ZigZag object with `settings`. If no settings are provided, a default ZigZag object is created.
Parameters:
settings : (series Settings) A Settings object.
Returns: (ZigZag) A new ZigZag instance.

Intrabar Efficiency Ratio█ OVERVIEW
This indicator displays a directional variant of Perry Kaufman's Efficiency Ratio, designed to gauge the "efficiency" of intrabar price movement by comparing the sum of movements of the lower timeframe bars composing a chart bar with the respective bar's movement on an average basis.
█ CONCEPTS
Efficiency Ratio (ER)
Efficiency Ratio was first introduced by Perry Kaufman in his 1995 book, titled "Smarter Trading". It is the ratio of absolute price change to the sum of absolute changes on each bar over a period. This tells us how strong the period's trend is relative to the underlying noise. Simply put, it's a measure of price movement efficiency. This ratio is the modulator utilized in Kaufman's Adaptive Moving Average (KAMA), which is essentially an Exponential Moving Average (EMA) that adapts its responsiveness to movement efficiency.
ER's output is bounded between 0 and 1. A value of 0 indicates that the starting price equals the ending price for the period, which suggests that price movement was maximally inefficient. A value of 1 indicates that price had travelled no more than the distance between the starting price and the ending price for the period, which suggests that price movement was maximally efficient. A value between 0 and 1 indicates that price had travelled a distance greater than the distance between the starting price and the ending price for the period. In other words, some degree of noise was present which resulted in reduced efficiency over the period.
As an example, let's say that the price of an asset had moved from $15 to $14 by the end of a period, but the sum of absolute changes for each bar of data was $4. ER would be calculated like so:
ER = abs(14 - 15)/4 = 0.25
This suggests that the trend was only 25% efficient over the period, as the total distanced travelled by price was four times what was required to achieve the change over the period.
Intrabars
Intrabars are chart bars at a lower timeframe than the chart's. Each 1H chart bar of a 24x7 market will, for example, usually contain 60 intrabars at the LTF of 1min, provided there was market activity during each minute of the hour. Mining information from intrabars can be useful in that it offers traders visibility on the activity inside a chart bar.
Lower timeframes (LTFs)
A lower timeframe is a timeframe that is smaller than the chart's timeframe. This script determines which LTF to use by examining the chart's timeframe. The LTF determines how many intrabars are examined for each chart bar; the lower the timeframe, the more intrabars are analyzed, but fewer chart bars can display indicator information because there is a limit to the total number of intrabars that can be analyzed.
Intrabar precision
The precision of calculations increases with the number of intrabars analyzed for each chart bar. As there is a 100K limit to the number of intrabars that can be analyzed by a script, a trade-off occurs between the number of intrabars analyzed per chart bar and the chart bars for which calculations are possible.
Intrabar Efficiency Ratio (IER)
Intrabar Efficiency Ratio applies the concept of ER on an intrabar level. Rather than comparing the overall change to the sum of bar changes for the current chart's timeframe over a period, IER compares single bar changes for the current chart's timeframe to the sum of absolute intrabar changes, then applies smoothing to the result. This gives an indication of how efficient changes are on the current chart's timeframe for each bar of data relative to LTF bar changes on an average basis. Unlike the standard ER calculation, we've opted to preserve directional information by not taking the absolute value of overall change, thus allowing it to be utilized as a momentum oscillator. However, by taking the absolute value of this oscillator, it could potentially serve as a replacement for ER in the design of adaptive moving averages.
Since this indicator preserves directional information, IER can be regarded as similar to the Chande Momentum Oscillator (CMO) , which was presented in 1994 by Tushar Chande in "The New Technical Trader". Both CMO and ER essentially measure the same relationship between trend and noise. CMO simply differs in scale, and considers the direction of overall changes.
█ FEATURES
Display
Three different display types are included within the script:
• Line : Displays the middle length MA of the IER as a line .
Color for this display can be customized via the "Line" portion of the "Visuals" section in the script settings.
• Candles : Displays the non-smooth IER and two moving averages of different lengths as candles .
The `open` and `close` of the candle are the longest and shortest length MAs of the IER respectively.
The `high` and `low` of the candle are the max and min of the IER, longest length MA of the IER, and shortest length MA of the IER respectively.
Colors for this display can be customized via the "Candles" portion of the "Visuals" section in the script settings.
• Circles : Displays three MAs of the IER as circles .
The color of each plot depends on the percent rank of the respective MA over the previous 100 bars.
Different colors are triggered when ranks are below 10%, between 10% and 50%, between 50% and 90%, and above 90%.
Colors for this display can be customized via the "Circles" portion of the "Visuals" section in the script settings.
With either display type, an optional information box can be displayed. This box shows the LTF that the script is using, the average number of lower timeframe bars per chart bar, and the number of chart bars that contain LTF data.
Specifying intrabar precision
Ten options are included in the script to control the number of intrabars used per chart bar for calculations. The greater the number of intrabars per chart bar, the fewer chart bars can be analyzed.
The first five options allow users to specify the approximate amount of chart bars to be covered:
• Least Precise (Most chart bars) : Covers all chart bars by dividing the current timeframe by four.
This ensures the highest level of intrabar precision while achieving complete coverage for the dataset.
• Less Precise (Some chart bars) & More Precise (Less chart bars) : These options calculate a stepped LTF in relation to the current chart's timeframe.
• Very precise (2min intrabars) : Uses the second highest quantity of intrabars possible with the 2min LTF.
• Most precise (1min intrabars) : Uses the maximum quantity of intrabars possible with the 1min LTF.
The stepped lower timeframe for "Less Precise" and "More Precise" options is calculated from the current chart's timeframe as follows:
Chart Timeframe Lower Timeframe
Less Precise More Precise
< 1hr 1min 1min
< 1D 15min 1min
< 1W 2hr 30min
> 1W 1D 60min
The last five options allow users to specify an approximate fixed number of intrabars to analyze per chart bar. The available choices are 12, 24, 50, 100, and 250. The script will calculate the LTF which most closely approximates the specified number of intrabars per chart bar. Keep in mind that due to factors such as the length of a ticker's sessions and rounding of the LTF, it is not always possible to produce the exact number specified. However, the script will do its best to get as close to the value as possible.
Specifying MA type
Seven MA types are included in the script for different averaging effects:
• Simple
• Exponential
• Wilder (RMA)
• Weighted
• Volume-Weighted
• Arnaud Legoux with `offset` and `sigma` set to 0.85 and 6 respectively.
• Hull
Weighting
This script includes the option to weight IER values based on the percent rank of absolute price changes on the current chart's timeframe over a specified period, which can be enabled by checking the "Weigh using relative close changes" option in the script settings. This places reduced emphasis on IER values from smaller changes, which may help to reduce noise in the output.
█ FOR Pine Script™ CODERS
• This script imports the recently published lower_ltf library for calculating intrabar statistics and the optimal lower timeframe in relation to the current chart's timeframe.
• This script uses the recently released request.security_lower_tf() Pine Script™ function discussed in this blog post .
It works differently from the usual request.security() in that it can only be used on LTFs, and it returns an array containing one value per intrabar.
This makes it much easier for programmers to access intrabar information.
• This script implements a new recommended best practice for tables which works faster and reduces memory consumption.
Using this new method, tables are declared only once with var , as usual. Then, on the first bar only, we use table.cell() to populate the table.
Finally, table.set_*() functions are used to update attributes of table cells on the last bar of the dataset.
This greatly reduces the resources required to render tables.
Look first. Then leap.

[PX] External LevelHello everyone,
today I'd like to share a script, which enables you to use external logic to plot levels on your chart.
How does it work?
The concept is based on two scripts. One script, which uses an external input as a trigger to print a new level and one script that calculates an output, which will be fetched.
Sounds complicated? It really is not! Let's take a closer look.
// This source code is subject to the terms of the Mozilla Public License 2.0 at mozilla.org
// © paaax
//@version=4
study("RSI OS/OB")
l = input(14, "RSI Length")
ob = input(70, "Overbought")
os = input(30, "Oversold")
r = rsi(close, l)
hline(ob)
hline(os)
plot(r, "RSI", color=color.orange)
// The following plot produces an output, which will be fetched the "External Level"-script.
// It evaluates to one of the following three values: 1.0, -1.0 or 0.0
plot(crossover(r, ob) ? 1.0 : crossunder(r, os) ? -1.0 : 0.0, "Output", transp=100)
The example script above uses an RSI and two threshold levels (70 and 30). The logic here is, that whenever the RSI is crossing down the lower threshold or crossing up the upper threshold we'd consider the current movement to be either oversold or overbought. Therefore, it's a point of interest, which we could visualize with a level.
The script creates an output when the crossover or crossunder of a threshold happens. A crossover would result in a value of 1.0, a crossunder in a value of -1.0. In all other cases the value would be 0.0.
The output of the RSI script would then be used as an input of the External Level script, which has a "Source"-parameter in its input-section. If the fetched input shows 1.0, then the script prints a resistance level. If it shows -1.0 a support level will be printed. And that's basically it. A very simple approach to print levels on your chart with an infinite number of use cases.
For example, you could use fetch outputs from a MACD script, MA script, outputs based on volume or price movement. Just remember the output has to evaluate to either 1.0 or -1.0 and has to be selected in the input-section.
Hope that might be useful to some of you :)
Please click the "Like"-button and follow me for future open-source script publications.
If you are looking for help with your custom PineScript development, don't hesitate to contact me directly here on Tradingview or through the link in my signature :)

SMT Divergence [Kodexius]SMT Divergence is a correlation-based divergence detector built around the Smart Money Technique concept: when two normally correlated instruments should be making similar swing progress, but one prints a new extreme while the other fails to confirm it. This “disagreement” can be a valuable contextual signal around liquidity runs, distribution phases, and potential reversal or continuation points.
The script compares the chart symbol (primary) with a user-selected comparison symbol (for example BTC vs ETH, ES vs NQ, EUR/USD vs GBP/USD) and automatically scans both instruments for confirmed swing highs and swing lows using pivot logic. Once swings are established, it checks for classic SMT conditions:
Primary makes a new swing extreme while the comparison symbol forms a non-confirming swing .
To support a wider range of markets, the indicator includes an Inverse Correlation option for pairs that typically move opposite to each other (for example DXY vs EUR/USD). With this enabled, the divergence rules are logically flipped so that the script still detects “non-confirmation” in a way that is consistent with the pair’s relationship.
The indicator is designed to be readable and actionable. It can draw divergence labels directly on the main chart, connect the relevant swing points with lines, show a compact information table with the last signal and settings, and optionally render the comparison symbol as a mini candle chart in the indicator pane for quick visual validation.
🔹 Features
🔸 Two-Symbol SMT Analysis (Primary vs Compare)
Select any comparison symbol to evaluate correlation structure and divergence. The script fetches the comparison OHLC data using the current chart timeframe to keep both series aligned for analysis.
🔸 Inverse Correlation Mode
For inversely correlated pairs, enable “Inverse Correlation” so the script interprets confirmation appropriately (for example, a higher low on the comparison instrument might be expected to correspond to a lower low on the primary, depending on the relationship). This helps avoid false conclusions when the pair naturally moves opposite.
🔸 Pivot-Based Swing with Adjustable Sensitivity
Swings are detected using confirmed pivots (left bars and right bars). This provides cleaner structural swing points compared with raw candle-to-candle comparisons, and it lets you control sensitivity for different market conditions and timeframes. The script also limits stored swing history to keep performance stable.
🔸 Flexible Detection Mode: Time Matched or Independent Swings
You can choose how swings are paired across instruments:
Time Matched searches for a comparison swing that occurred at the same pivot time as the primary swing.
Independent Swings compares each symbol’s own last two swings without requiring an exact time match.
🔸 Range Control and Noise Filtering
To reduce weak or irrelevant signals:
“Max Bars Between Swings” ensures the two swings being compared are close enough in structure to be meaningful.
“Min Price Diff (%)” can require a minimum percentage change between the primary’s last two swing prices to confirm the move is significant.
🔸 Clear Visual Output with Tooltips
When a divergence is detected, the script can print a label (“SMT”) with bullish or bearish styling and a tooltip that includes the symbol pair and the primary swing price for quick context.
🔸 Divergence Lines for Context
Optional lines connect the relevant swing points, making it easier to see the exact structure that triggered the signal. One line can be drawn on the main chart and another in the indicator pane for the comparison series.
🔸 Info Table (At a Glance)
A compact table can display the active symbols, correlation mode, total divergences stored, and the most recent signal type.
🔸 Alerts Included
Built-in alert conditions are provided for bullish SMT, bearish SMT, and any SMT event so you can automate notifications without editing the code.
🔸 Optional Comparison Candle Panel
If enabled, the indicator can plot the comparison symbol as candles in the indicator pane. This is useful for confirming whether the divergence is happening around major levels, consolidations, or impulsive legs on the secondary instrument.
🔹 Calculations
This section summarizes the core logic used by the script.
1. Data Synchronization (Comparison Symbol)
The comparison instrument is requested on the chart’s current timeframe so swing calculations are performed consistently:
=
request.security(compareSymbolInput, timeframe.period, )
This ensures pivots and swing times are derived from the same bar cadence as the primary chart.
2. Swing Detection via Confirmed Pivots
Swings are detected using pivot logic with user-defined left and right bars:
primaryPivotHigh = ta.pivothigh(high, pivotLeftBars, pivotRightBars)
primaryPivotLow = ta.pivotlow(low, pivotLeftBars, pivotRightBars)
Because pivots are confirmed only after the “right bars” have closed, the script stores each swing using an offset so the swing’s bar index and time reflect where the pivot actually occurred, not where it was confirmed.
3. Swing Storage and Retrieval
Both symbols maintain arrays of SwingPoint objects. Each new swing is pushed into the array, and older swings are dropped once the array exceeds the configured maximum. This makes the divergence engine predictable and prevents uncontrolled memory growth.
The script then retrieves the last and previous swing highs and lows (per symbol) to evaluate structure.
4. Matching Logic (Time Matched vs Independent)
When “Time Matched” is selected, the script searches the comparison swing array for a pivot that occurred at the exact same timestamp as the primary swing. When “Independent Swings” is selected, it simply uses the comparison symbol’s last two swings of the same type.
5. Bullish SMT Condition (LL vs HL)
A bullish SMT event is defined as:
Primary forms a lower low (last low < previous low)
Comparison forms a higher low (last low > previous low)
If inverse correlation is enabled, the comparison condition flips to maintain logical confirmation rules
The two primary swings must be within the configured bar distance window
Optional minimum percentage difference must be satisfied
A simple anti duplication rule prevents repeated triggers on the same structure
These checks are implemented directly in the bullish detection block.
6. Bearish SMT Condition (HH vs LH)
A bearish SMT event is defined as:
Primary forms a higher high (last high > previous high)
Comparison forms a lower high (last high < previous high)
Inverse correlation flips the comparison rule
Range checks, minimum difference filtering, and duplicate protection apply similarly
These checks are implemented in the bearish detection block.
7. Percentage Difference Filter
The optional “Min Price Diff (%)” filter measures the relative distance between the last two primary swing prices. This prevents very small structural changes from being treated as valid SMT signals.
priceDiffPerc = math.abs(lastSwing.price - prevSwing.price) / prevSwing.price * 100.0
The divergence condition is only allowed to trigger if this value exceeds the user defined threshold.
priceOk = priceDiffPerc >= minPriceDiff
This filter is especially useful on higher timeframes or during low volatility conditions, where micro structure noise can otherwise produce misleading signals.
8. Visualization and Output
When a divergence is confirmed, the script:
Stores the event in a divergence array (limited by “Max Divergences to Display”)
Draws a directional SMT label with a tooltip (optional)
Draws connecting lines using time based coordinates for clean alignment (optional)
It also updates an information table on the last bar only, and exposes alertconditions for automation workflows.

Superior-Range Bound Renko - Alerts - 11-29-25 - Signal LynxSuperior-Range Bound Renko – Alerts Edition with Advanced Risk Management Template
Signal Lynx | Free Scripts supporting Automation for the Night-Shift Nation 🌙
1. Overview
This is the Alerts & Indicator Edition of Superior-Range Bound Renko (RBR).
The Strategy version is built for backtesting inside TradingView.
This Alerts version is built for automation: it emits clean, discrete alert events that you can route into webhooks, bots, or relay engines (including your own Signal Lynx-style infrastructure).
Under the hood, this script contains the same core engine as the strategy:
Adaptive Range Bounding based on volatility
Renko Brick Emulation on standard candles
A stack of Laguerre Filters for impulse detection
K-Means-style Adaptive SuperTrend for trend confirmation
The full Signal Lynx Risk Management Engine (state machine, layered exits, AATS, RSIS, etc.)
The difference is in what we output:
Instead of placing historical trades, this version:
Plots the entry and RM signals in a separate pane (overlay = false)
Exposes alertconditions for:
Long Entry
Short Entry
Close Long
Close Short
TP1, TP2, TP3 hits (Staged Take Profit)
This makes it ideal as the signal source for automated execution via TradingView Alerts + Webhooks.
2. Quick Action Guide (TL;DR)
Best Timeframe:
4H and above. This is a swing-trading / position-trading style engine, not a micro-scalper.
Best Assets:
Volatile but structured markets, e.g.:
BTC, ETH, XAUUSD (Gold), GBPJPY, and similar high-volatility majors or indices.
Script Type:
indicator() – Alerts & Visualization Only
No built-in order placement
All “orders” are emitted as alerts for your external bot or manual handling
Strategy Type:
Volatility-Adaptive Trend Following + Impulse Detection
using Renko-like structure and multi-layer Laguerre filters.
Repainting:
Designed to be non-repainting on closed candles.
The underlying Risk Management engine is built around previous-bar data (close , high , low ) for execution-critical logic.
Intrabar values can move while the bar is forming (normal for any advanced signal), but once a bar closes, the alert logic is stable.
Recommended Alert Settings:
Condition: one of the built-in signals (see section 3.B)
Options: “Once Per Bar Close” is strongly recommended for automation
Message: JSON, CSV, or simple tokens – whatever your webhook / relay expects
3. Detailed Report: How the Alerts Edition Works
A. Relationship to the Strategy Version
The Alerts Edition shares the same internal logic as the strategy version:
Same Adaptive Lookback and volatility normalization
Same Range and Close Range construction
Same Renko Brick Emulator and directional memory (renkoDir)
Same Fib structures, Laguerre stack, K-Means SuperTrend, and Baseline signals (B1, B2)
Same Risk Management Engine and layered exits
In the strategy script, these signals are wired into strategy.entry, strategy.exit, and strategy.close.
In the alerts script:
We still compute the final entry/exit signals (Fin, CloseEmAll, TakeProfit1Plot, etc.)
Instead of placing trades, we:
Plot them for visual inspection
Expose them via alertcondition(...) so that TradingView can fire alerts.
This ensures that:
If you use the same settings on the same symbol/timeframe, the Alerts Edition and Strategy Edition agree on where entries and exits occur.
(Subject only to normal intrabar vs. bar-close differences.)
B. Signals & Alert Conditions
The alerts script focuses on discrete, automation-friendly events.
Internally, the main signals are:
Fin – Final entry decision from the RM engine
CloseEmAll – RM-driven “hard close” signal (for full-position exits)
TakeProfit1Plot / 2Plot / 3Plot – One-time event markers when each TP stage is hit
On the chart (in the separate indicator pane), you get:
plot(Fin) – where:
+2 = Long Entry event
-2 = Short Entry event
plot(CloseEmAll) – where:
+1 = “Close Long” event
-1 = “Close Short” event
plot(TP1/TP2/TP3) (if Staged TP is enabled) – integer tags for TP hits:
+1 / +2 / +3 = TP1 / TP2 / TP3 for Longs
-1 / -2 / -3 = TP1 / TP2 / TP3 for Shorts
The corresponding alertconditions are:
Long Entry
alertcondition(Fin == 2, title="Long Entry", message="Long Entry Triggered")
Fire this to open/scale a long position in your bot.
Short Entry
alertcondition(Fin == -2, title="Short Entry", message="Short Entry Triggered")
Fire this to open/scale a short position.
Close Long
alertcondition(CloseEmAll == 1, title="Close Long", message="Close Long Triggered")
Fire this to fully exit a long position.
Close Short
alertcondition(CloseEmAll == -1, title="Close Short", message="Close Short Triggered")
Fire this to fully exit a short position.
TP 1 Hit
alertcondition(TakeProfit1Plot != 0, title="TP 1 Hit", message="TP 1 Level Reached")
First staged take profit hit (either long or short). Your bot can interpret the direction based on position state or message tags.
TP 2 Hit
alertcondition(TakeProfit2Plot != 0, title="TP 2 Hit", message="TP 2 Level Reached")
TP 3 Hit
alertcondition(TakeProfit3Plot != 0, title="TP 3 Hit", message="TP 3 Level Reached")
Together, these give you a complete trade lifecycle:
Open Long / Short
Optionally scale out via TP1/TP2/TP3
Close remaining via Close Long / Close Short
All while the Risk Management Engine enforces the same logic as the strategy version.
C. Using This Script for Automation
This Alerts Edition is designed for:
Webhook-based bots
Execution relays (e.g., your own Lynx-Relay-style engine)
Dedicated external trade managers
Typical setup flow:
Add the script to your chart
Same symbol, timeframe, and settings you use in the Strategy Edition backtests.
Configure Inputs:
Longs / Shorts enabled
Risk Management toggles (SL, TS, Staged TP, AATS, RSIS)
Weekend filter (if you do not want weekend trades)
RBR-specific knobs (Adaptive Lookback, Brick type, ATR vs Standard Brick, etc.)
Create Alerts for Each Event Type You Need:
Long Entry
Short Entry
Close Long
Close Short
TP1 / TP2 / TP3 (optional, if your bot handles partial closes)
For each:
Condition: the corresponding alertcondition
Option: “Once Per Bar Close” is strongly recommended
Message:
You can use structured JSON or a simple token set like:
{"side":"long","event":"entry","symbol":"{{ticker}}","time":"{{timenow}}"}
or a simpler text for manual trading like:
LONG ENTRY | {{ticker}} | {{interval}}
Wire Up Your Bot / Relay:
Point TradingView’s webhook URL to your execution engine
Parse the messages and map them into:
Exchange
Symbol
Side (long/short)
Action (open/close/partial)
Size and risk model (this script does not position-size for you; it only signals when, not how much.)
Because the alerts come from a non-repainting, RM-backed engine that you’ve already validated via the Strategy Edition, you get a much cleaner automation pipeline.
D. Repainting Protection (Alerts Edition)
The same protections as the Strategy Edition apply here:
Execution-critical logic (trailing stop, TP triggers, SL, RM state changes) uses previous bar OHLC:
open , high , low , close
No security() with lookahead or future-bar dependencies.
This means:
Alerts are designed to fire on states that would have been visible at bar close, not on hypothetical “future history.”
Important practical note:
Intrabar: While a bar is forming, internal conditions can oscillate.
Bar Close: With “Once Per Bar Close” alerts, the fired signal corresponds to the final state of the engine for that candle, matching your Strategy Edition expectations.
4. For Developers & Modders
You can treat this Alerts script as an ”RM + Alert Framework” and inject any signal logic you want.
Where to plug in:
Find the section:
// BASELINE & SIGNAL GENERATION
You’ll see how B1 and B2 are built from the RBR stack and then combined:
baseSig = B2
altSig = B1
finalSig = sigSwap ? baseSig : altSig
To use your own logic:
Replace or wrap the code that sets baseSig / altSig with your own conditions:
e.g., RSI, MACD, Heikin Ashi filters, candle patterns, volume filters, etc.
Make sure your final decision is still:
2 → Long / Buy signal
-2 → Short / Sell signal
0 → No trade
finalSig is then passed into the RM engine and eventually becomes Fin, which:
Drives the Long/Short Entry alerts
Interacts with the RM state machine to integrate properly with AATS, SL, TS, TP, etc.
Because this script already exposes alertconditions for key lifecycle events, you don’t need to re-wire alerts each time — just ensure your logic feeds into finalSig correctly.
This lets you use the Signal Lynx Risk Management Engine + Alerts wrapper as a drop-in chassis for your own strategies.
5. About Signal Lynx
Automation for the Night-Shift Nation 🌙
Signal Lynx builds tools and templates that help traders move from:
“I have an indicator” → “I have a structured, automatable strategy with real risk management.”
This Superior-Range Bound Renko – Alerts Edition is the automation-focused companion to the Strategy Edition. It’s designed for:
Traders who backtest with the Strategy version
Then deploy live signals with this Alerts version via webhooks or bots
While relying on the same non-repainting, RM-driven logic
We release this code under the Mozilla Public License 2.0 (MPL-2.0) to support the Pine community with:
Transparent, inspectable logic
A reusable Risk Management template
A reference implementation of advanced adaptive logic + alerts
If you are exploring full-stack automation (TradingView → Webhooks → Exchange / VPS), keep Signal Lynx in your search.
License: Mozilla Public License 2.0 (Open Source).
If you build improvements or helpful variants, please consider sharing them back with the community.

Material Color Palette Library█ OVERVIEW
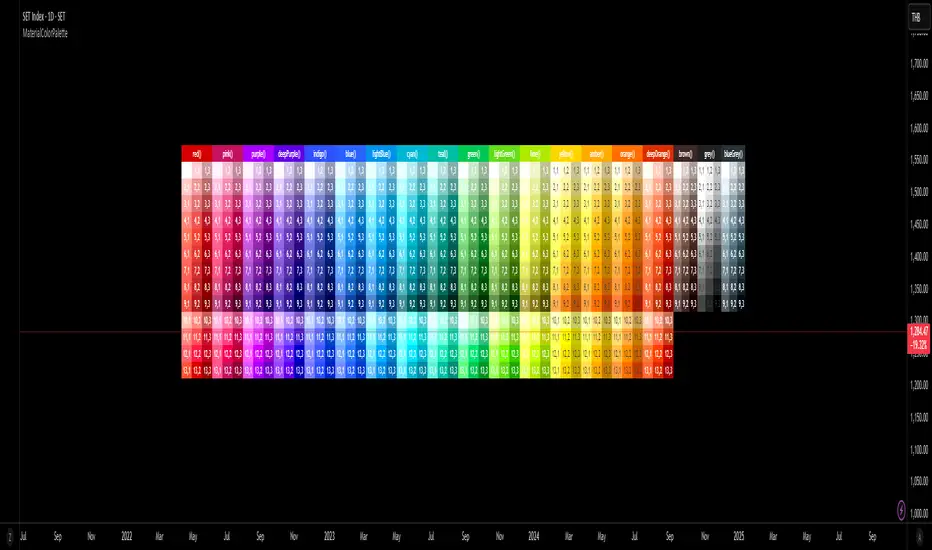
Unlock a world of color in your Pine Script® projects with the Material Color Palette Library . This library provides a comprehensive and structured color system based on Google's Material Design palette, making it incredibly easy to create visually appealing and professional-looking indicators and strategies.
Forget about guessing hex codes. With this library, you have access to 19 distinct color families, each offering a wide range of shades. Every color can be fine-tuned with saturation, darkness, and opacity levels, giving you precise control over your script's appearance.
To make development even easier, the library includes a visual cheatsheet. Simply add the script to your chart to display a full table of all available colors and their corresponding parameters.
█ KEY FEATURES
Vast Spectrum: 19 distinct color families, from vibrant reds and blues to subtle greys and browns.
Fine-Tuned Control: Each color function accepts parameters for `saturationLevel` (1-13 or 1-9) and `darkLevel` (1-3) to select the perfect shade.
Opacity Parameter: Easily add transparency to any color for fills, backgrounds, or lines.
Quick Access Tones: A simple `tone()` function to grab base colors by name.
Visual Cheatsheet: An on-chart table displays the entire color palette, serving as a handy reference guide during development.
█ HOW TO USE
As a library, this script is meant to be imported into your own indicators or strategies.
1. Import the Library
Add the following line to the top of your script. Remember to replace `YourUsername` with your TradingView username.
import mastertop/ColorPalette/1 as colors
2. Call a Color Function
You can now use any of the exported functions to set colors for your plots, backgrounds, tables, and more.
The primary functions take three arguments: `functionName(saturationLevel, darkLevel, opacity)`
`saturationLevel`: An integer that controls the intensity of the color. Ranges from 1 (lightest) to 13 (most vibrant) for most colors, and 1-9 for `brown`, `grey`, and `blueGrey`.
`darkLevel`: An integer from 1 to 3 (1: light, 2: medium, 3: dark).
`opacity`: An integer from 0 (opaque) to 100 (invisible).
Example Usage:
Let's plot a moving average with a specific shade of teal.
// Import the library
import mastertop/ColorPalette/1 as colors
indicator("My Script with Custom Colors", overlay = true)
// Calculate a moving average
ma = ta.sma(close, 20)
// Plot the MA using a color from the library
// We'll use teal with saturation level 7, dark level 2, and 0% opacity
plot(ma, "MA", color = colors.teal(7, 2, 0), linewidth = 2)
3. Using the `tone()` Function
For quick access to a base color, you can use the `tone()` function.
// Set a red background with 85% transparency
bgcolor(colors.tone('red', 85))
█ VISUAL REFERENCE
To see all available colors at a glance, you can add this library script directly to your chart. It will display a comprehensive table showing every color variant. This makes it easy to pick the exact shade you need without guesswork.
This library is designed for fellow Pine Script® developers to streamline their workflow and enhance the visual quality of their scripts. Enjoy!
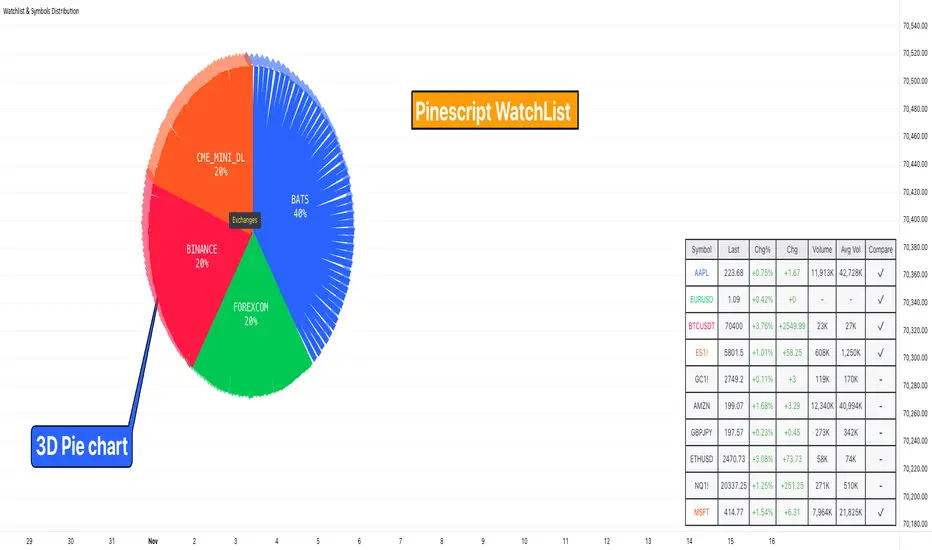
Watchlist & Symbols Distribution [Daveatt]TLDR;
I got bored so I just coded the TradingView watchlist interface in Pinescript :)
TLDR 2:
Sharing it open-source what took me 1 full day to code - haven't coded in Pinescript in a long time, so I'm a bit slow for now :)
█ OVERVIEW
This script offers a comprehensive market analysis tool inspired by TradingView's native watchlist interface features.
It combines an interactive watchlist with powerful distribution visualization capabilities and a performance comparison panel.
The script was developed with a focus on providing multiple visualization methods while working within PineScript's limitations.
█ DEVELOPMENT BACKGROUND
The pie chart implementation was greatly inspired by the ( "Crypto Map Dashboard" script / )
adapting its circular visualization technique to create dynamic distribution charts. However, due to PineScript's 500-line limitation per script, I had to optimize the code to allow users to switch between pie chart analysis and performance comparison modes rather than displaying both simultaneously.
█ SETUP AND DISPLAY
For optimal visualization, users need to adjust the chart's display settings manually.
This involves:
Expanding the indicator window vertically to accommodate both the watchlist and graphical elements
Adjusting the Y-axis scale by dragging it to ensure proper spacing for the comparison panel grid
Modifying the X-axis scale to achieve the desired time window display
Fine-tuning these adjustments whenever switching between pie chart and comparison panel modes
These manual adjustments are necessary due to PineScript's limitations in controlling chart scaling programmatically. While this requires some initial setup, it allows users to customize the display to their preferred viewing proportions.
█ MAIN FEATURES
Distribution Analysis
The script provides three distinct distribution visualization modes through a pie chart.
Users can analyze their symbols by exchanges, asset types (such as Crypto, Forex, Futures), or market sectors.
If you can't see it well at first, adjust your chart scaling until it's displayed nicely.
Asset Exchanges
www.tradingview.com
Asset Types
Asset Sectors
The pie charts feature an optional 3D effect with adjustable depth and angle parameters. To enhance visual customization, four different color schemes are available: Default, Pastel, Dark, and Neon.
Each segment of the pie chart includes interactive tooltips that can be configured to show different levels of detail. Importantly, the pie chart only visualizes the distribution of selected assets (those marked with a checkmark in the watchlist), providing a focused view of the user's current interests.
Interactive Watchlist
The watchlist component displays real-time data for up to 10 user-defined symbols. Each entry shows current price, price changes (both absolute and percentage), volume metrics, and a comparison toggle.
The table is dynamically updated and features color-coded entries that correspond to their respective performance lines in the comparison chart. The watchlist serves as both an information display and a control panel for the comparison feature.
Performance Comparison
One of the script's most innovative features is its performance comparison panel.
Using polylines for smooth visualization, it tracks the 30-day performance of selected symbols relative to a 0% baseline.
The comparison chart includes a sophisticated grid system with 5% intervals and a dynamic legend showing current performance values.
The polyline implementation allows for fluid, continuous lines that accurately represent price movements, providing a more refined visual experience than traditional line plots. Like the pie charts, the comparison panel only displays performance lines for symbols that have been selected in the watchlist, allowing users to focus on their specific assets of interest.
█ TECHNICAL IMPLEMENTATION
The script utilizes several advanced PineScript features:
Dynamic array management for symbol tracking
Polyline-based charting for smooth performance visualization
Real-time data processing with security calls
Interactive tooltips and labels
Optimized drawing routines to maintain performance
Selective visualization based on user choices
█ CUSTOMIZATION
Users can personalize almost every aspect of the script:
Symbol selection and comparison preferences
Visual theme selection with four distinct color schemes
Pie chart dimensions and positioning
Tooltip information density
Component visibility toggles
█ LIMITATIONS
The primary limitation stems from PineScript's 500-line restriction per script.
This constraint necessitated the implementation of a mode-switching system between pie charts and the comparison panel, as displaying both simultaneously would exceed the line limit. Additionally, the script relies on manual chart scale adjustments, as PineScript doesn't provide direct control over chart scaling when overlay=false is enabled.
However, these limitations led to a more focused and efficient design approach that gives users control over their viewing experience.
█ CONCLUSION
All those tools exist in the native TradingView watchlist interface and they're better than what I just did.
However, now it exists in Pinescript... so I believe it's a win lol :)
Supertrend Alert with Arrows and Time FilterOverview
This script is designed to generate trading signals based on the Supertrend indicator, a popular technical analysis tool. The Supertrend indicator is used to identify the direction of the market trend and potential reversal points.
Supertrend Settings
The script uses two sets of Supertrend settings:
Small Supertrend
Factor: 3.0
ATR Period: 10
Big Supertrend
Factor: 10.0
ATR Period: 30
These settings are fixed and should not be altered to maintain the integrity of the signal generation process.
Configurable Parameters
startHour: The hour at which signal generation begins.
endHour: The hour at which signal generation ends.
These parameters allow users to focus on specific trading hours, optimizing the signal relevance to their trading strategy.
Signal Types
The script generates two types of signals:
Type 1: Reversal Signal
Long Signal: Triggered when the big Supertrend is in an uptrend, and the small Supertrend transitions from a downtrend to an uptrend.
Short Signal: Triggered when the big Supertrend is in a downtrend, and the small Supertrend transitions from an uptrend to a downtrend.
Type 2: Trend Change Signal
Long Signal: Triggered when the big Supertrend changes from a downtrend to an uptrend.
Short Signal: Triggered when the big Supertrend changes from an uptrend to a downtrend.
How the Script Works
Initialization: The script initializes with predefined Supertrend settings.
Data Input: Market data (e.g., price data) is fed into the script.
Supertrend Calculation: The script calculates the Supertrend values using the predefined factors and ATR periods.
Signal Detection: The script monitors the Supertrend values and detects the defined signals based on the conditions mentioned above.
Time Filtering: Signals are filtered based on the specified startHour and endHour, ensuring only relevant signals are displayed within the desired timeframe.
Usage
Set Parameters: Define startHour and endHour according to your trading schedule.
Run Script: Execute the script with market data input.
Interpret Signals: Monitor the generated signals and use them to inform your trading decisions.
Originality
Dual Supertrend Usage: The use of both a small and a big Supertrend to generate signals adds a layer of complexity and reliability to the signals.
Time-Based Filtering: Allows traders to focus on specific trading hours, enhancing the relevance and accuracy of signals.
Two Signal Types: The combination of reversal signals and trend change signals provides comprehensive market insights.
Conclusion
This Supertrend Signal Generator is a robust tool for traders seeking to leverage the Supertrend indicator for more informed trading decisions. By combining dual Supertrend settings and configurable trading hours, the script offers unique and flexible signal generation capabilities.

dashboard MTF,EMA User Guide: Dashboard MTF EMA
Script Installation:
Copy the script code.
Go to the script window (Pine Editor) on TradingView.
Paste the code into the script window.
Save the script.
Adding the Script to the Chart:
Return to your chart on TradingView.
Look for the script in the list of available scripts.
Add the script to the chart.
Interpreting the Table:
On the right side of the chart, you will see a table labeled "EMA" with arrows.
The rows correspond to different timeframes: 5 minutes (5M), 15 minutes (15M), 1 hour (1H), 4 hours (4H), and 1 day (1D).
Understanding the Arrows:
Each row of the table has two columns: "EMA" and an arrow.
"EMA" indicates the trend of the Exponential Moving Average (EMA) for the specified period.
The arrow indicates the direction of the trend: ▲ for bullish, ▼ for bearish.
Table Colors:
The colors of the table reflect the current trend based on the comparison between fast and slow EMAs.
Blue (▲) indicates a bullish trend.
Red (▼) indicates a bearish trend.
Table Theme:
The table has a dark (Dark) or light (Light) theme according to your preference.
The background, frame, and colors are adjusted based on the selected theme.
Usage:
Use the table as a quick indicator of trends on different timeframes.
The arrows help you quickly identify trends without navigating between different time units.
Designed to simplify analysis and avoid cluttering the chart with multiple indicators.

Pro Trading Art - Head And ShouldersHow the Script Works:
1. The script identifies potential Head and Shoulders patterns by searching for specific pivot highs and pivot lows in the price data.
2. It checks for the presence of a left shoulder, head, and right shoulder based on the conditions defined in the script.
3. If a valid Head and Shoulders pattern is found, the script plots lines and labels on the chart to visualize the pattern.
4. The script also identifies Inverted Head and Shoulders patterns using similar logic but with different conditions.
5. It plots lines and labels for the Inverted Head and Shoulders pattern.
6. The script generates short and long conditions based on the patterns. Short conditions trigger when the close price crosses below the neck level of a Head and Shoulders pattern, while long conditions trigger when the close price crosses above the neck level of an Inverted Head and Shoulders pattern.
7. It plots sell and buy signal shapes on the chart when the short and long conditions are met, respectively.
8. The script can also trigger alerts to notify the user when a valid Head and Shoulders or Inverted Head and Shoulders pattern is detected.
9. The script provides visual cues on the chart to help users identify potential trading opportunities.
10. The logic and parameters of the script can be modified by the user to customize the behavior and adapt it to different trading strategies.
How Users Can Make Profit Using This Script:
1. Identify potential short-selling opportunities: When a valid Head and Shoulders pattern is detected and a short condition is met, it indicates a potential trend reversal. Traders can consider opening short positions to profit from a downward price movement.
2. Identify potential long-buying opportunities: When a valid Inverted Head and Shoulders pattern is detected and a long condition is met, it suggests a potential trend reversal. Traders can consider opening long positions to profit from an upward price movement.
3. Combine with additional analysis: Users can utilize this script as a tool in their overall trading strategy. They can combine the signals generated by the script with other technical indicators, fundamental analysis, or market sentiment to make more informed trading decisions.
4. Define appropriate entry and exit points: Traders can use the lines and labels plotted by the script to determine entry and exit points for their trades. For example, they may choose to enter a short position after the price crosses below the neck level and exit when the price reaches a predetermined target or when the pattern is invalidated.
5. Set risk management measures: It is important for users to implement proper risk management strategies when trading based on the script's signals. They should define stop-loss orders to limit potential losses if the trade goes against them and consider setting profit targets to secure profits when the trade moves in their favor.

Strategy BackTest Display Statistics - TraderHalaiThis script was born out of my quest to be able to display strategy back test statistics on charts to allow for easier backtesting on devices that do not natively support backtest engine (such as mobile phones, when I am backtesting from away from my computer). There are already a few good ones on TradingView, but most / many are too complicated for my needs.
Found an excellent display backtest engine by 'The Art of Trading'. This script is a snippet of his hard work, with some very minor tweaks and changes. Much respect to the original author.
Full credit to the original author of this script. It can be found here: www.tradingview.com
I decided to modify the script by simplifying it down and make it easier to integrate into existing strategies, using simple copy and paste, by relying on existing tradingview strategy backtester inputs. I have also added 3 additional performance metrics:
- Max Run Up
- Average Win per trade
- Average Loss per trade
As this is a work in progress, I will look to add in more performance metrics in future, as I further develop this script.
Feel free to use this display panel in your scripts and strategies.
Thanks and enjoy :)

Tick travel ⍗This script is a further exploration of 'ticks' (only on realtime - live bars), based on my previous script:
- www.tradingview.com -
What are 'ticks'?
... Once the script’s execution reaches the rightmost bar in the dataset, if trading is currently active on the chart’s symbol,
then Pine indicators will execute once every time an update occurs, i.e., price or volume changes ...
(www.tradingview.com)
This script has 2 parts:
1) Option: ' Tick up/down'
This is a further progression of previous work.
During bar development, every time there is an update (tick), a dot is placed.
If for example there is 1 tick (first of new bar), a dot will be placed on 1,
if it is the 8th tick off that bar, there will be a dot placed on 8.
While my previous script had the issue that there was an upper limit per bar (max 32),
this script (because it is working with labels) can place max 500 dots.
For each bar this is better, it has to be mentioned though that looking in history, once the limit of 500 has been reached,
you'll notice the last ones are being deleted. This is one of the reasons the script is not suitable for higher timeframes
(1h and higher, even higher than 5 minutes can give some issues if it is a highly traded ticker), if a bar would have more
than 500 ticks, they won't be drawn anymore (which is not desirable of course)
2) Option: ' Tick progression'
These are the same ticks, but placed on the candle itself, or you can show the candle:
Or 'without' candle (or 'black' colour):
When 'No candles' are enabled, the 'candles' get the colour at the right.
At the moment it is not possible to drawn between 2 candles, this technique uses labels with 'text',
each tick on a candle will have a 'space' added, so you can see a progression to the right.
Colours
- if price is higher than previous tick price -> green
- if price is lower than previous tick price -> red
- otherwise -> blue (dimmed)
There are options to choose the 'dot', when choosing 'custom',
just enter (copy/paste) your symbol of your choice in the 'custom' field:
Caveats:
- Labels and text will not always be exactly on the price itself
- The scripts needs more testings, possibly some ticks don't always get drawn as they should.
The lower the timeframe, the more possible issues can occur
- Since (candle option) the dots move to the right, the higher the timeframe and/or the more ticks,
the sooner ticks will go in the area of next candle.
That's why I made a separate 'start symbol'
-> This is the very first tick on each candle, then you can zoom in/out more easily until the dots don't merge into each other candle area:
A timeframe higher than 5 minutes mostly won't be feasible I believe
This script wouldn't be possible without the help of @LucF, also because of his script
With very much respect I am hugely inspired by him! Many Thanks to him, Tradingview, and everything associated with them!
Cheers!

logLibrary "log"
Logging library for easily displaying debug, info, warn, error and critical messages.
No real need to explain why you might want to use this library! I'm sure you've all experienced the frustration of trying to understand the data state of your scripts... so, enjoy! More on it's way...
(Don't forget to check the helpers in the script and the useful tips below)
Some Useful Tips
By default the log console persists between bars (for history) and bars and ticks (for realtime).
Sometimes it is useful to clear the log after each candle or tick (assuming we are using the above helpers):
```
log_print(clear = true) // starts afresh on every bar and tick (excludes historical bars but good realtime tick analysis)
log_print(clear = barstate.isnew) // clears the log at the start of each bar (again, excludes historical but good realtime candle analysis)
```
It is also useful to be able to selectively understand the state of data at specific points or times within a script:
```
if log.once()
debug('useful variable', my_var) // this log only gets written once, upon first execution of this statement
if log.only(5)
debug3(a, b, c) // these variables are only logged the first five times this statement is executed
log_print(clear = false) // clear must be false and you should not write other logs on every bar, or the above will be lost
```
Final tip. If you want to view ONLY log entries of a particular level, then negate the constant:
```
log_print(level = -LOG_DEBUG)
```
Detailed Interface
once() Restrict execution to only happen once. Usage: if assert.once()\n happens_once()
Returns: bool, true on first execution within scope, false subsequently
only(repeat) Restrict execution to happen a set number of times. Usage: if assert.only(5)\n happens_five_times()
Parameters:
repeat : int, the number of times to return true
Returns: bool, true for the set number of times within scope, false subsequently
init() Initialises the log array
Returns: string , tuple based array to contain all pending log entries (__LOG)
clear(msgs) Clears the log array
Parameters:
msgs : string , the current collection of unfiltered and unprocessed logs (__LOG)
trace(msgs, msg) Writes a trace message to the log console
Parameters:
msgs : string , the current collection of unfiltered and unprocessed logs (__LOG)
msg : string, the trace message to write to the log
debug(msgs, msg) Writes a debug message to the log console
Parameters:
msgs : string , the current collection of unfiltered and unprocessed logs (__LOG)
msg : string, the debug message to write to the log
info(msgs, msg) Writes an info message to the log console
Parameters:
msgs : string , the current collection of unfiltered and unprocessed logs (__LOG)
msg : string, the info message to write to the log
warn(msgs, msg) Writes a warning message to the log console
Parameters:
msgs : string , the current collection of unfiltered and unprocessed logs (__LOG)
msg : string, the warn message to write to the log
error(msgs, msg) Writes an error message to the log console
Parameters:
msgs : string , the current collection of unfiltered and unprocessed logs (__LOG)
msg : string, the error message to write to the log
fatal(msgs, msg) Writes a critical message to the log console
Parameters:
msgs : string , the current collection of unfiltered and unprocessed logs (__LOG)
msg : string, the fatal message to write to the log
log(msgs, level, msg) Write a log message to the log console with a custom level
Parameters:
msgs : string , the current collection of unfiltered and unprocessed logs (__LOG)
level : ing, the logging level to assign to the message
msg : string, the log message to write to the log
severity(msgs) Checks the unprocessed log messages and returns the highest present level
Parameters:
msgs : string , the current collection of unfiltered and unprocessed logs (__LOG)
Returns: int, the highest level found within the unfiltered logs
print(msgs, level, clear, rows, text_size, position) Prints all log messages to the screen
Parameters:
msgs : string , the current collection of unfiltered and unprocessed logs (__LOG)
level : int, the minimum required log level of each message to be displayed
clear : bool, clear the printed log console after each render (useful with realtime when set to barstate.isconfirmed)
rows : int, the number of rows to display in the log console
text_size : string, the text size of the log console (global size vars)
position : string, the position of the log console (global position vars)
unittest_log(case) Log module unit tests, for inclusion in parent script test suite. Usage: log.unittest_log(__ASSERTS)
Parameters:
case : string , the current test case and array of previous unit tests (__ASSERTS)
unittest(verbose) Run the log module unit tests as a stand alone. Usage: log.unittest()
Parameters:
verbose : bool, optionally disable the full report to only display failures

assertLibrary "assert"
Production ready assertions and auto-reporting for unit testing pine scripts.
This library was born from the need to maintain production level stability and catch regressions / bugs early and fast. I hope this help you trust your pine scripts too. More libraries and tools on their way... please follow for more.
Please see the script for helpers to copy into your own scripts as well as examples at the bottom of the library unit testing itself.
Quick Reference
```
case = assert.init()
new_case(case, 'Asserts for floats and ints')
assert.equal(a, b, case, 'a == b')
assert.not_equal(a, b, case, 'a != b')
assert.nan(a, case, 'a == na')
assert.not_nan(a, case, 'a != na')
assert.is_in(a, b, case, 'a in b ')
assert.is_not_in(a, b, case, 'a not in b ')
assert.array_equal(a, b, case, 'a == b ')
new_case(case, 'Asserts for ints only')
assert.int_in(a, b, case, 'a in b ')
assert.int_not_in(a, b, case, 'a not in b ')
assert.int_array_equal(a, b, case, 'a == b ')
new_case(case, 'Asserts for bools only')
assert.is_true(a, case, 'a == true')
assert.is_false(a, case, 'a == false')
assert.bool_equal(a, b, case, 'a == b')
assert.bool_not_equal(a, b, case, 'a != b')
assert.bool_nan(a, case, 'a == na')
assert.bool_not_nan(a, case, 'a != na')
assert.bool_array_equal(a, b, case, 'a == b ')
new_case(case, 'Asserts for strings only')
assert.str_equal(a, b, case, 'a == b')
assert.str_not_equal(a, b, case, 'a != b')
assert.str_nan(a, case, 'a == na')
assert.str_not_nan(a, case, 'a != na')
assert.str_in(a, b, case, 'a in b ')
assert.str_not_in(a, b, case, 'a not in b ')
assert.str_array_equal(a, b, case, 'a == b ')
assert.report(case)
```
Detailed Interface
once() Restrict execution to only happen once. Usage: if assert.once()\n happens_once()
Returns: bool, true on first execution within scope, false subsequently
init() Initialises the asserts array
Returns: string , tuple based array containing all unit test results and current case details (__ASSERTS)
equal(a, b, case, name) Numeric assert equal. Usage: assert.equal(1, 1, case, 'one == one')
Parameters:
a : float, numeric value "a" to compare equal to "b"
b : float, numeric value "b" to compare equal to "a"
case : string , the current test case and array of previous unit tests (__ASSERTS)
name : string, the current unit test name, if undefined the test index of the current case is used
Returns: bool, true if the assertion passes, false otherwise
not_equal(a, b, case, name) Numeric assert not equal. Usage: assert.not_equal(1, 2, case, 'one != two')
Parameters:
a : float, numeric value "a" to compare not equal "b"
b : float, numeric value "b" to compare not equal "a"
case : string , the current test case and array of previous unit tests (__ASSERTS)
name : string, the current unit test name, if undefined the test index of the current case is used
Returns: bool, true if the assertion passes, false otherwise
nan(a, case, name) Numeric assert is NaN. Usage: assert.nan(float(na), case, 'number is NaN')
Parameters:
a : float, numeric value "a" to check is NaN
case : string , the current test case and array of previous unit tests (__ASSERTS)
name : string, the current unit test name, if undefined the test index of the current case is used
Returns: bool, true if the assertion passes, false otherwise
not_nan(a, case, name) Numeric assert is not NaN. Usage: assert.not_nan(1, case, 'number is not NaN')
Parameters:
a : float, numeric value "a" to check is not NaN
case : string , the current test case and array of previous unit tests (__ASSERTS)
name : string, the current unit test name, if undefined the test index of the current case is used
Returns: bool, true if the assertion passes, false otherwise
is_in(a, b, case, name) Numeric assert value in float array. Usage: assert.is_in(1, array.from(1.0), case, '1 is in ')
Parameters:
a : float, numeric value "a" to check is in array "b"
b : float , array "b" to check contains "a"
case : string , the current test case and array of previous unit tests (__ASSERTS)
name : string, the current unit test name, if undefined the test index of the current case is used
Returns: bool, true if the assertion passes, false otherwise
is_not_in(a, b, case, name) Numeric assert value not in float array. Usage: assert.is_not_in(2, array.from(1.0), case, '2 is not in ')
Parameters:
a : float, numeric value "a" to check is not in array "b"
b : float , array "b" to check does not contain "a"
case : string , the current test case and array of previous unit tests (__ASSERTS)
name : string, the current unit test name, if undefined the test index of the current case is used
Returns: bool, true if the assertion passes, false otherwise
array_equal(a, b, case, name) Float assert arrays are equal. Usage: assert.array_equal(array.from(1.0), array.from(1.0), case, ' == ')
Parameters:
a : float , array "a" to check is identical to array "b"
b : float , array "b" to check is identical to array "a"
case : string , the current test case and array of previous unit tests (__ASSERTS)
name : string, the current unit test name, if undefined the test index of the current case is used
Returns: bool, true if the assertion passes, false otherwise
int_in(a, b, case, name) Integer assert value in integer array. Usage: assert.int_in(1, array.from(1), case, '1 is in ')
Parameters:
a : int, value "a" to check is in array "b"
b : int , array "b" to check contains "a"
case : string , the current test case and array of previous unit tests (__ASSERTS)
name : string, the current unit test name, if undefined the test index of the current case is used
Returns: bool, true if the assertion passes, false otherwise
int_not_in(a, b, case, name) Integer assert value not in integer array. Usage: assert.int_not_in(2, array.from(1), case, '2 is not in ')
Parameters:
a : int, value "a" to check is not in array "b"
b : int , array "b" to check does not contain "a"
case : string , the current test case and array of previous unit tests (__ASSERTS)
name : string, the current unit test name, if undefined the test index of the current case is used
Returns: bool, true if the assertion passes, false otherwise
int_array_equal(a, b, case, name) Integer assert arrays are equal. Usage: assert.int_array_equal(array.from(1), array.from(1), case, ' == ')
Parameters:
a : int , array "a" to check is identical to array "b"
b : int , array "b" to check is identical to array "a"
case : string , the current test case and array of previous unit tests (__ASSERTS)
name : string, the current unit test name, if undefined the test index of the current case is used
Returns: bool, true if the assertion passes, false otherwise
is_true(a, case, name) Boolean assert is true. Usage: assert.is_true(true, case, 'is true')
Parameters:
a : bool, value "a" to check is true
case : string , the current test case and array of previous unit tests (__ASSERTS)
name : string, the current unit test name, if undefined the test index of the current case is used
Returns: bool, true if the assertion passes, false otherwise
is_false(a, case, name) Boolean assert is false. Usage: assert.is_false(false, case, 'is false')
Parameters:
a : bool, value "a" to check is false
case : string , the current test case and array of previous unit tests (__ASSERTS)
name : string, the current unit test name, if undefined the test index of the current case is used
Returns: bool, true if the assertion passes, false otherwise
bool_equal(a, b, case, name) Boolean assert equal. Usage: assert.bool_equal(true, true, case, 'true == true')
Parameters:
a : bool, value "a" to compare equal to "b"
b : bool, value "b" to compare equal to "a"
case : string , the current test case and array of previous unit tests (__ASSERTS)
name : string, the current unit test name, if undefined the test index of the current case is used
Returns: bool, true if the assertion passes, false otherwise
bool_not_equal(a, b, case, name) Boolean assert not equal. Usage: assert.bool_not_equal(true, false, case, 'true != false')
Parameters:
a : bool, value "a" to compare not equal "b"
b : bool, value "b" to compare not equal "a"
case : string , the current test case and array of previous unit tests (__ASSERTS)
name : string, the current unit test name, if undefined the test index of the current case is used
Returns: bool, true if the assertion passes, false otherwise
bool_nan(a, case, name) Boolean assert is NaN. Usage: assert.bool_nan(bool(na), case, 'bool is NaN')
Parameters:
a : bool, value "a" to check is NaN
case : string , the current test case and array of previous unit tests (__ASSERTS)
name : string, the current unit test name, if undefined the test index of the current case is used
Returns: bool, true if the assertion passes, false otherwise
bool_not_nan(a, case, name) Boolean assert is not NaN. Usage: assert.bool_not_nan(true, case, 'bool is not NaN')
Parameters:
a : bool, value "a" to check is not NaN
case : string , the current test case and array of previous unit tests (__ASSERTS)
name : string, the current unit test name, if undefined the test index of the current case is used
Returns: bool, true if the assertion passes, false otherwise
bool_array_equal(a, b, case, name) Boolean assert arrays are equal. Usage: assert.bool_array_equal(array.from(true), array.from(true), case, ' == ')
Parameters:
a : bool , array "a" to check is identical to array "b"
b : bool , array "b" to check is identical to array "a"
case : string , the current test case and array of previous unit tests (__ASSERTS)
name : string, the current unit test name, if undefined the test index of the current case is used
Returns: bool, true if the assertion passes, false otherwise
str_equal(a, b, case, name) String assert equal. Usage: assert.str_equal('hi', 'hi', case, '"hi" == "hi"')
Parameters:
a : string, value "a" to compare equal to "b"
b : string, value "b" to compare equal to "a"
case : string , the current test case and array of previous unit tests (__ASSERTS)
name : string, the current unit test name, if undefined the test index of the current case is used
Returns: bool, true if the assertion passes, false otherwise
str_not_equal(a, b, case, name) String assert not equal. Usage: assert.str_not_equal('hi', 'bye', case, '"hi" != "bye"')
Parameters:
a : string, value "a" to compare not equal "b"
b : string, value "b" to compare not equal "a"
case : string , the current test case and array of previous unit tests (__ASSERTS)
name : string, the current unit test name, if undefined the test index of the current case is used
Returns: bool, true if the assertion passes, false otherwise
str_nan(a, case, name) String assert is NaN. Usage: assert.str_nan(string(na), case, 'string is NaN')
Parameters:
a : string, value "a" to check is NaN
case : string , the current test case and array of previous unit tests (__ASSERTS)
name : string, the current unit test name, if undefined the test index of the current case is used
Returns: bool, true if the assertion passes, false otherwise
str_not_nan(a, case, name) String assert is not NaN. Usage: assert.str_not_nan('hi', case', 'string is not NaN')
Parameters:
a : string, value "a" to check is not NaN
case : string , the current test case and array of previous unit tests (__ASSERTS)
name : string, the current unit test name, if undefined the test index of the current case is used
Returns: bool, true if the assertion passes, false otherwise
str_in(a, b, case, name) String assert value in string array. Usage: assert.str_in('hi', array.from('hi'), case, '"hi" in ')
Parameters:
a : string, value "a" to check is in array "b"
b : string , array "b" to check contains "a"
case : string , the current test case and array of previous unit tests (__ASSERTS)
name : string, the current unit test name, if undefined the test index of the current case is used
Returns: bool, true if the assertion passes, false otherwise
str_not_in(a, b, case, name) String assert value not in string array. Usage: assert.str_in('hi', array.from('bye'), case, '"hi" in ')
Parameters:
a : string, value "a" to check is not in array "b"
b : string , array "b" to check does not contain "a"
case : string , the current test case and array of previous unit tests (__ASSERTS)
name : string, the current unit test name, if undefined the test index of the current case is used
Returns: bool, true if the assertion passes, false otherwise
str_array_equal(a, b, case, name) String assert arrays are equal. Usage: assert.str_array_equal(array.from('hi'), array.from('hi'), case, ' == ')
Parameters:
a : string , array "a" to check is identical to array "b"
b : string , array "b" to check is identical to array "a"
case : string , the current test case and array of previous unit tests (__ASSERTS)
name : string, the current unit test name, if undefined the test index of the current case is used
Returns: bool, true if the assertion passes, false otherwise
new_case(case, name) Assign a new test case name, for the next set of unit tests. Usage: assert.new_case(case, 'My tests')
Parameters:
case : string , the current test case and array of previous unit tests (__ASSERTS)
name : string, the case name for the next suite of tests
clear(case) Clear all stored unit tests from all cases. Usage: assert.clear(case)
Parameters:
case : string , the current test case and array of previous unit tests (__ASSERTS)
revert(case) Revert the previous unit test. Usage: = assert.revert(case)
Parameters:
case : string , the current test case and array of previous unit tests (__ASSERTS)
Returns: , tuple containing the msg and result of the reverted test
passed(case, revert) Check if the last unit test has passed. Usage: bool success = assert.passed(case)
Parameters:
case : string , the current test case and array of previous unit tests (__ASSERTS)
revert : bool, optionally revert the test
Returns: bool, true only if the test passed
failed(case, revert) Check if the last unit test has failed. Usage: bool failure = assert.failed(case)
Parameters:
case : string , the current test case and array of previous unit tests (__ASSERTS)
revert : bool, optionally revert the test
Returns: bool, true only if the test failed
report(case, verbose) Report the outcome of unit tests that fail. Usage: bool passed = assert.report(case)
Parameters:
case : string , the current test case and array of previous unit tests (__ASSERTS)
verbose : bool, optionally display full report that includes the outcome of all tests
Returns: bool, true only if all tests passed
unittest_assert(case) Assert module unit tests, for inclusion in parent script test suite. Usage: assert.unittest_assert(__ASSERTS)
Parameters:
case : string , the current test case and array of previous unit tests (__ASSERTS)
unittest(verbose) Run the assert module unit tests as a stand alone. Usage: assert.unittest()
Parameters:
verbose : bool, optionally toggle report to display the outcome of all unit tests

Matrix Library (Linear Algebra, incl Multiple Linear Regression)What's this all about?
Ever since 1D arrays were added to Pine Script, many wonderful new opportunities have opened up. There has been a few implementations of matrices and matrix math (most notably by TradingView-user tbiktag in his recent Moving Regression script: ). However, so far, no comprehensive libraries for matrix math and linear algebra has been developed. This script aims to change that.
I'm not math expert, but I like learning new things, so I took it upon myself to relearn linear algebra these past few months, and create a matrix math library for Pine Script. The goal with the library was to make a comprehensive collection of functions that can be used to perform as many of the standard operations on matrices as possible, and to implement functions to solve systems of linear equations. The library implements matrices using arrays, and many standard functions to manipulate these matrices have been added as well.
The main purpose of the library is to give users the ability to solve systems of linear equations (useful for Multiple Linear Regression with K number of independent variables for example), but it can also be used to simulate 2D arrays for any purpose.
So how do I use this thing?
Personally, what I do with my private Pine Script libraries is I keep them stored as text-files in a Libraries folder, and I copy and paste them into my code when I need them. This library is quite large, so I have made sure to use brackets in comments to easily hide any part of the code. This helps with big libraries like this one.
The parts of this script that you need to copy are labeled "MathLib", "ArrayLib", and "MatrixLib". The matrix library is dependent on the functions from these other two libraries, but they are stripped down to only include the functions used by the MatrixLib library.
When you have the code in your script (pasted somewhere below the "study()" call), you can create a matrix by calling one of the constructor functions. All functions in this library start with "matrix_", and all constructors start with either "create" or "copy". I suggest you read through the code though. The functions have very descriptive names, and a short description of what each function does is included in a header comment directly above it. The functions generally come in the following order:
Constructors: These are used to create matrices (empy with no rows or columns, set shape filled with 0s, from a time series or an array, and so on).
Getters and setters: These are used to get data from a matrix (like the value of an element or a full row or column).
Matrix manipulations: These functions manipulate the matrix in some way (for example, functions to append columns or rows to a matrix).
Matrix operations: These are the matrix operations. They include things like basic math operations for two indices, to transposing a matrix.
Decompositions and solvers: Next up are functions to solve systems of linear equations. These include LU and QR decomposition and solvers, and functions for calculating the pseudo-inverse or inverse of a matrix.
Multiple Linear Regression: Lastly, we find an implementation of a multiple linear regression, including all the standard statistics one can expect to find in most statistical software packages.
Are there any working examples of how to use the library?
Yes, at the very end of the script, there is an example that plots the predictions from a multiple linear regression with two independent (explanatory) X variables, regressing the chart data (the Y variable) on these X variables. You can look at this code to see a real-world example of how to use the code in this library.
Are there any limitations?
There are no hard limiations, but the matrices uses arrays, so the number of elements can never exceed the number of elements supported by Pine Script (minus 2, since two elements are used internally by the library to store row and column count). Some of the operations do use a lot of resources though, and as a result, some things can not be done without timing out. This can vary from time to time as well, as this is primarily dependent on the available resources from the Pine Script servers. For instance, the multiple linear regression cannot be used with a lookback window above 10 or 12 most of the time, if the statistics are reported. If no statistics are reported (and therefore not calculated), the lookback window can usually be extended to around 60-80 bars before the servers time out the execution.
Hopefully the dev-team at TradingView sees this script and find ways to implement this functionality diretly into Pine Script, as that would speed up many of the operations and make things like MLR (multiple linear regression) possible on a bigger lookback window.
Some parting words
This library has taken a few months to write, and I have taken all the steps I can think of to test it for bugs. Some may have slipped through anyway, so please let me know if you find any, and I'll try my best to fix them when I have time to do so. This library is intended to help the community. Therefore, I am releasing the library as open source, in the hopes that people may improving on it, or using it in their own work. If you do make something cool with this, or if you find ways to improve the code, please let me know in the comments.

EMA TrendThe purpose of this script is to identify price trends based on EMAs. The relative position of price to specific EMAs and the position of certain EMAs towards each other are used to determine the trend direction. The script is intended for investors as a tool to define a basis for further evaluation. I do not use the script as a signal generator and would not recommend doing so without the help of additional indicators.
How to work with the script
The major (or long term) trend direction is determined by the 144 EMA much in the same way as the 200 MA is used in other systems. If the price is above the 144 EMA we are in a long term uptrend, below we are in a long term downtrend. This is to be taken with a grain of salt though. The 144 EMA is considerably shorter than the 200 SMA and is more prone to the price fluctuating around it during periods without a strong long term trend. I recommend using this as a confirmation for the short term trend.
The short term trend is derived from the position and slope of the price, the 21 EMA and the 55 EMA. If the price is above the 21 EMA, the 21 above the 55 EMA, both EMAs are sloping upwards and the distance between the two is increasing, we are talking about an uptrend (and vice versa for a downtrend). This is visualized by the color of the fill between the 144 EMA and close price. Green for uptrend, red for downtrend and no color for an undetermined trend.
The EMAs used are: 21 , 34 , 55 , 89 , 144 , 233 . Most of the EMAs are at 50 transparency to appear less dominant. For orientation, the 144 EMA is bright green to indicate its general importance for the trend determination, and the 55 EMAs is not transparent mainly to be able to identify positioning when the EMAs are close together.
Base time frame EMA
The 144 EMA is plotted twice where one is fixed to the daily time frame (can be configured) to be able to have the 144 on different timeframes during analysis. I find this very useful to keep the focus on my main time frame while analyzing trend on lower or higher time frames. This can also be turned off.
Configurability
This script is less configurable than I generally like with my other scripts. The reason is that the title attribute of the plots is not dynamic, and I use the data window often to get exact values from the script to determine buy targets for pullbacks and other things. Hence, I prefer not to have random names (or no names) in there to save mental capacity. If this ever becomes available, I'll gladly add this to this script. Till then, I encourage you to take the script and adjust it to your own needs. It should be simple enough even if you are just starting out in pine.

Waindrops [Makit0]█ OVERALL
Plot waindrops (custom volume profiles) on user defined periods, for each period you get high and low, it slices each period in half to get independent vwap, volume profile and the volume traded per price at each half.
It works on intraday charts only, up to 720m (12H). It can plot balanced or unbalanced waindrops, and volume profiles up to 24H sessions.
As example you can setup unbalanced periods to get independent volume profiles for the overnight and cash sessions on the futures market, or 24H periods to get the full session volume profile of EURUSD
The purpose of this indicator is twofold:
1 — from a Chartist point of view, to have an indicator which displays the volume in a more readable way
2 — from a Pine Coder point of view, to have an example of use for two very powerful tools on Pine Script:
• the recently updated drawing limit to 500 (from 50)
• the recently ability to use drawings arrays (lines and labels)
If you are new to Pine Script and you are learning how to code, I hope you read all the code and comments on this indicator, all is designed for you,
the variables and functions names, the sometimes too big explanations, the overall structure of the code, all is intended as an example on how to code
in Pine Script a specific indicator from a very good specification in form of white paper
If you wanna learn Pine Script form scratch just start HERE
In case you have any kind of problem with Pine Script please use some of the awesome resources at our disposal: USRMAN , REFMAN , AWESOMENESS , MAGIC
█ FEATURES
Waindrops are a different way of seeing the volume and price plotted in a chart, its a volume profile indicator where you can see the volume of each price level
plotted as a vertical histogram for each half of a custom period. By default the period is 60 so it plots an independent volume profile each 30m
You can think of each waindrop as an user defined candlestick or bar with four key values:
• high of the period
• low of the period
• left vwap (volume weighted average price of the first half period)
• right vwap (volume weighted average price of the second half period)
The waindrop can have 3 different colors (configurable by the user):
• GREEN: when the right vwap is higher than the left vwap (bullish sentiment )
• RED: when the right vwap is lower than the left vwap (bearish sentiment )
• BLUE: when the right vwap is equal than the left vwap ( neutral sentiment )
KEY FEATURES
• Help menu
• Custom periods
• Central bars
• Left/Right VWAPs
• Custom central bars and vwaps: color and pixels
• Highly configurable volume histogram: execution window, ticks, pixels, color, update frequency and fine tuning the neutral meaning
• Volume labels with custom size and color
• Tracking price dot to be able to see the current price when you hide your default candlesticks or bars
█ SETTINGS
Click here or set any impar period to see the HELP INFO : show the HELP INFO, if it is activated the indicator will not plot
PERIOD SIZE (max 2880 min) : waindrop size in minutes, default 60, max 2880 to allow the first half of a 48H period as a full session volume profile
BARS : show the central and vwap bars, default true
Central bars : show the central bars, default true
VWAP bars : show the left and right vwap bars, default true
Bars pixels : width of the bars in pixels, default 2
Bars color mode : bars color behavior
• BARS : gets the color from the 'Bars color' option on the settings panel
• HISTOGRAM : gets the color from the Bearish/Bullish/Neutral Histogram color options from the settings panel
Bars color : color for the central and vwap bars, default white
HISTOGRAM show the volume histogram, default true
Execution window (x24H) : last 24H periods where the volume funcionality will be plotted, default 5
Ticks per bar (max 50) : width in ticks of each histogram bar, default 2
Updates per period : number of times the histogram will update
• ONE : update at the last bar of the period
• TWO : update at the last bar of each half period
• FOUR : slice the period in 4 quarters and updates at the last bar of each of them
• EACH BAR : updates at the close of each bar
Pixels per bar : width in pixels of each histogram bar, default 4
Neutral Treshold (ticks) : delta in ticks between left and right vwaps to identify a waindrop as neutral, default 0
Bearish Histogram color : histogram color when right vwap is lower than left vwap, default red
Bullish Histogram color : histogram color when right vwap is higher than left vwap, default green
Neutral Histogram color : histogram color when the delta between right and left vwaps is equal or lower than the Neutral treshold, default blue
VOLUME LABELS : show volume labels
Volume labels color : color for the volume labels, default white
Volume Labels size : text size for the volume labels, choose between AUTO, TINY, SMALL, NORMAL or LARGE, default TINY
TRACK PRICE : show a yellow ball tracking the last price, default true
█ LIMITS
This indicator only works on intraday charts (minutes only) up to 12H (720m), the lower chart timeframe you can use is 1m
This indicator needs price, time and volume to work, it will not work on an index (there is no volume), the execution will not be allowed
The histogram (volume profile) can be plotted on 24H sessions as limit but you can plot several 24H sessions
█ ERRORS AND PERFORMANCE
Depending on the choosed settings, the script performance will be highly affected and it will experience errors
Two of the more common errors it can throw are:
• Calculation takes too long to execute
• Loop takes too long
The indicator performance is highly related to the underlying volatility (tick wise), the script takes each candlestick or bar and for each tick in it stores the price and volume, if the ticker in your chart has thousands and thousands of ticks per bar the indicator will throw an error for sure, it can not calculate in time such amount of ticks.
What all of that means? Simply put, this will throw error on the BITCOIN pair BTCUSD (high volatility with tick size 0.01) because it has too many ticks per bar, but lucky you it will work just fine on the futures contract BTC1! (tick size 5) because it has a lot less ticks per bar
There are some options you can fine tune to boost the script performance, the more demanding option in terms of resources consumption is Updates per period , by default is maxed out so lowering this setting will improve the performance in a high way.
If you wanna know more about how to improve the script performance, read the HELP INFO accessible from the settings panel
█ HOW-TO SETUP
The basic parameters to adjust are Period size , Ticks per bar and Pixels per bar
• Period size is the main setting, defines the waindrop size, to get a better looking histogram set bigger period and smaller chart timeframe
• Ticks per bar is the tricky one, adjust it differently for each underlying (ticker) volatility wise, for some you will need a low value, for others a high one.
To get a more accurate histogram set it as lower as you can (min value is 1)
• Pixels per bar allows you to adjust the width of each histogram bar, with it you can adjust the blank space between them or allow overlaping
You must play with these three parameters until you obtain the desired histogram: smoother, sharper, etc...
These are some of the different kind of charts you can setup thru the settings:
• Balanced Waindrops (default): charts with waindrops where the two halfs are of same size.
This is the default chart, just select a period (30m, 60m, 120m, 240m, pick your poison), adjust the histogram ticks and pixels and watch
• Unbalanced Waindrops: chart with waindrops where the two halfs are of different sizes.
Do you trade futures and want to plot a waindrop with the first half for the overnight session and the second half for the cash session? you got it;
just adjust the period to 1860 for any CME ticker (like ES1! for example) adjust the histogram ticks and pixels and watch
• Full Session Volume Profile: chart with waindrops where only the first half plots.
Do you use Volume profile to analize the market? Lucky you, now you can trick this one to plot it, just try a period of 780 on SPY, 2760 on ES1!, or 2880 on EURUSD
remember to adjust the histogram ticks and pixels for each underlying
• Only Bars: charts with only central and vwap bars plotted, simply deactivate the histogram and volume labels
• Only Histogram: charts with only the histogram plotted (volume profile charts), simply deactivate the bars and volume labels
• Only Volume: charts with only the raw volume numbers plotted, simply deactivate the bars and histogram
If you wanna know more about custom full session periods for different asset classes, read the HELP INFO accessible from the settings panel
EXAMPLES
Full Session Volume Profile on MES 5m chart:
Full Session Unbalanced Waindrop on MNQ 2m chart (left side Overnight session, right side Cash Session):
The following examples will have the exact same charts but on four different tickers representing a futures contract, a forex pair, an etf and a stock.
We are doing this to be able to see the different parameters we need for plotting the same kind of chart on different assets
The chart composition is as follows:
• Left side: Volume Labels chart (period 10)
• Upper Right side: Waindrops (period 60)
• Lower Right side: Full Session Volume Profile
The first example will specify the main parameters, the rest of the charts will have only the differences
MES :
• Left: Period size: 10, Bars: uncheck, Histogram: uncheck, Execution window: 1, Ticks per bar: 2, Updates per period: EACH BAR,
Pixels per bar: 4, Volume labels: check, Track price: check
• Upper Right: Period size: 60, Bars: check, Bars color mode: HISTOGRAM, Histogram: check, Execution window: 2, Ticks per bar: 2,
Updates per period: EACH BAR, Pixels per bar: 4, Volume labels: uncheck, Track price: check
• Lower Right: Period size: 2760, Bars: uncheck, Histogram: check, Execution window: 1, Ticks per bar: 1, Updates per period: EACH BAR,
Pixels per bar: 2, Volume labels: uncheck, Track price: check
EURUSD :
• Upper Right: Ticks per bar: 10
• Lower Right: Period size: 2880, Ticks per bar: 1, Pixels per bar: 1
SPY :
• Left: Ticks per bar: 3
• Upper Right: Ticks per bar: 5, Pixels per bar: 3
• Lower Right: Period size: 780, Ticks per bar: 2, Pixels per bar: 2
AAPL :
• Left: Ticks per bar: 2
• Upper Right: Ticks per bar: 6, Pixels per bar: 3
• Lower Right: Period size: 780, Ticks per bar: 1, Pixels per bar: 2
█ THANKS TO
PineCoders for all they do, all the tools and help they provide and their involvement in making a better community
scarf for the idea of coding a waindrops like indicator, I did not know something like that existed at all
All the Pine Coders, Pine Pros and Pine Wizards, people who share their work and knowledge for the sake of it and helping others, I'm very grateful indeed
I'm learning at each step of the way from you all, thanks for this awesome community;
Opensource and shared knowledge: this is the way! (said with canned voice from inside my helmet :D)
█ NOTE
This description was formatted following THIS guidelines
═════════════════════════════════════════════════════════════════════════
I sincerely hope you enjoy reading and using this work as much as I enjoyed developing it :D
GOOD LUCK AND HAPPY TRADING!

[blackcat] L2 FiboKAMA Adaptive TrendOVERVIEW
The L2 FiboKAMA Adaptive Trend indicator leverages advanced technical analysis techniques by integrating Fibonacci principles with the Kaufman Adaptive Moving Average (KAMA). This combination creates a dynamic and responsive tool designed to adapt seamlessly to changing market conditions. By providing clear buy and sell signals based on adaptive momentum, this indicator helps traders identify potential entry and exit points effectively. Its intuitive design and robust features make it a valuable addition to any trader’s arsenal 📊💹.
According to the principle of Kaufman's Adaptive Moving Average (KAMA), it is a type of moving average line specifically designed for markets with high volatility. Unlike traditional moving averages, KAMA can automatically adjust its period based on market conditions to improve accuracy and responsiveness. This makes it particularly useful for capturing market trends and reducing false signals in varying market environments.
The use of Fibonacci magic numbers (3, 8, 13) enhances the performance and accuracy of KAMA. These numbers have special mathematical properties that align well with the changing trends of KAMA moving averages. Combining them with KAMA can significantly boost its effectiveness, making it a popular choice among traders seeking reliable signals.
This fusion not only smoothens price fluctuations but also ensures quick responses to market changes, offering dependable entry and exit points. Thanks to the flexibility and precision of KAMA combined with Fibonacci magic numbers, traders can better manage risks and aim for higher returns.
FEATURES
Enhanced Kaufman Adaptive Moving Average (KAMA): Incorporates Fibonacci principles for improved adaptability:
Source Price: Allows customization of the price series used for calculation (default: HLCC4).
Fast Length: Determines the period for quicker adjustments to recent price changes.
Slow Length: Sets the period for smoother transitions over longer-term trends.
Dynamic Lines:
KAMA Line: A yellow line representing the primary adaptive moving average, which adapts quickly to new trends.
Trigger Line: A fuchsia line serving as a reference point for detecting crossovers and generating signals.
Visual Cues:
Buy Signals: Green 'B' labels indicating potential buying opportunities.
Sell Signals: Red 'S' labels signaling possible selling points.
Fill Areas: Colored regions between the KAMA and Trigger lines to visually represent trend directions and strength.
Alert Functionality: Generates real-time alerts for both buy and sell signals, ensuring timely notifications for actionable insights 🔔.
Customizable Parameters: Offers flexibility through adjustable inputs, allowing users to tailor the indicator to their specific trading strategies and preferences.
HOW TO USE
Adding the Indicator:
Open your TradingView chart and navigate to the indicators list.
Select L2 FiboKAMA Adaptive Trend and add it to your chart.
Configuring Parameters:
Adjust the Source Price to choose the desired price series (e.g., close, open, high, low).
Set the Fast Length to define how quickly the indicator responds to recent price movements.
Configure the Slow Length to determine the smoothness of long-term trend adaptations.
Interpreting Signals:
Monitor the chart for green 'B' labels indicating buy signals and red 'S' labels for sell signals.
Observe the colored fill areas between the KAMA and Trigger lines to gauge trend strength and direction.
Setting Up Alerts:
Enable alerts within the indicator settings to receive notifications whenever buy or sell signals are triggered.
Customize alert messages and frequencies according to your trading plan.
Combining with Other Tools:
Integrate this indicator with additional technical analysis tools and fundamental research for comprehensive decision-making.
Confirm signals using other indicators like RSI, MACD, or Bollinger Bands for increased reliability.
Optimizing Performance:
Backtest the indicator across various assets and timeframes to understand its behavior under different market conditions.
Fine-tune parameters based on historical performance and current market dynamics.
Integrating Magic Numbers:
Understand the basic principles of KAMA to find suitable entry points for Fibonacci magic numbers.
Utilize the efficiency ratio to measure market volatility and adjust moving average parameters accordingly.
Apply Fibonacci magic numbers (3, 8, 13) to enhance the responsiveness and accuracy of KAMA.
LIMITATIONS
Market Volatility: May produce false signals during periods of extreme volatility or sideways movement.
Parameter Sensitivity: Requires careful tuning of fast and slow lengths to balance responsiveness and stability.
Asset-Specific Behavior: Effectiveness can vary significantly across different financial instruments and time horizons.
Complementary Analysis: Should be used alongside other analytical methods to enhance accuracy and reduce risk.
NOTES
Historical Data: Ensure adequate historical data availability for precise calculations and backtesting.
Demo Testing: Thoroughly test the indicator on demo accounts before deploying it in live trading environments.
Continuous Learning: Stay updated with market trends and continuously refine your strategy incorporating feedback from the indicator's performance.
Risk Management: Always implement proper risk management practices regardless of the signals provided by the indicator.
ADVANCED USAGE TIPS
Multi-Timeframe Analysis: Apply the indicator across multiple timeframes to gain deeper insights into underlying trends.
Divergence Strategy: Look for divergences between price action and the KAMA line to spot potential reversals early.
Volume Integration: Combine volume analysis with the indicator to confirm the strength of identified trends.
Custom Scripting: Modify the script to include additional filters or conditions tailored to your unique trading approach.
IMPROVING KAMA PERFORMANCE
Increase Length: Extend the KAMA length to consider more historical data, reducing the impact of short-term price fluctuations.
Adjust Fast and Slow Lengths: Make KAMA smoother by increasing the fast length and decreasing the slow length.
Use Smoothing Factor: Apply a smoothing factor to control the level of smoothness; typical values range from 0 to 1.
Combine with Other Indicators: Pair KAMA with other smoothing indicators like EMA or SMA for more reliable signals.
Filter Noise: Use filters or other technical analysis tools to eliminate price noise, enhancing KAMA's effectiveness.
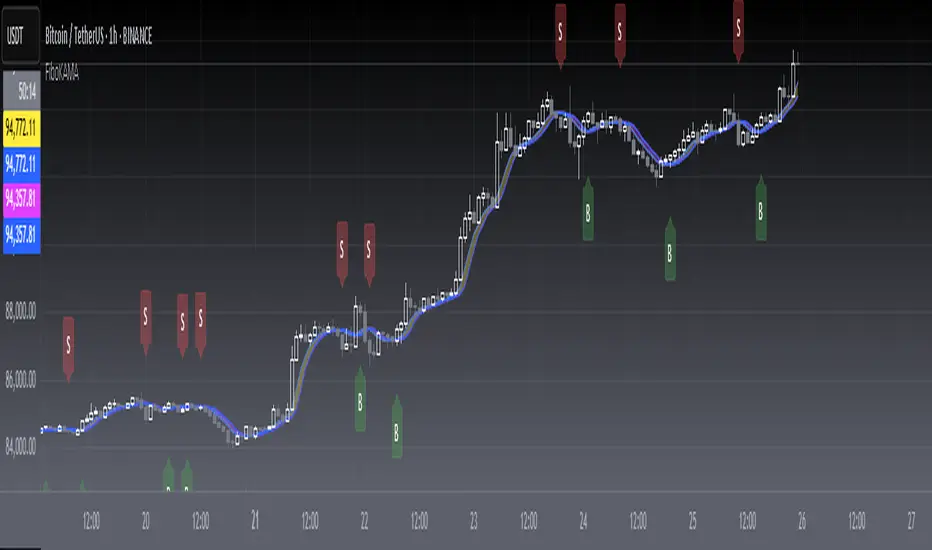
Business Cycle Indicators (Normalized)This script aggregates and normalizes several key economic indicators to provide a comprehensive view of the business cycle and overall market conditions. By combining these indicators into a single, normalized average line, the script helps identify overarching trends and shifts in the economy, aiding in more informed trading and investment decisions.
Included Indicators:
Inverted National Financial Conditions Index (NFCI):
Symbol: FRED:NFCI
Measures financial stress in the markets. An inverted NFCI aligns higher values with positive financial conditions.
Inverted Net Percentage of Banks Tightening Lending Standards (DRTSCIS):
Symbol: FRED:DRTSCIS
Reflects changes in bank lending practices. Inverting this indicator means higher values indicate easing lending standards, which is generally positive for economic growth.
HYG Close Price (iShares High Yield Corporate Bond ETF):
Symbol: AMEX:HYG
Represents the performance of high-yield corporate bonds, providing insight into credit market conditions.
Inverted High-Yield Credit Spread (BAMLH0A0HYM2):
Symbol: FRED:BAMLH0A0HYM2
Measures the spread between high-yield bonds and risk-free securities. A narrower (inverted) spread indicates better market conditions.
Manufacturing/Non-Manufacturing New Orders Ratio:
Symbols: ECONOMICS:USMNO (Manufacturing), ECONOMICS:USNMNO (Non-Manufacturing)
Compares manufacturing to non-manufacturing new orders to gauge shifts in economic activity.
US PMI (Purchasing Managers' Index):
Symbol: ECONOMICS:USBCOI
An indicator of the economic health of the manufacturing sector.
10-Year Inflation Breakeven (T10YIE):
Symbol: FRED:T10YIE
Represents market expectations of inflation over the next ten years.
Inverted 10-Year Real Yield (DFII10):
Symbol: FRED:DFII10
Reflects the real yield on 10-year Treasury Inflation-Protected Securities (TIPS). Inverted to align higher values with positive economic sentiment.
Copper/Gold Ratio:
Symbols: CAPITALCOM:COPPER (Copper), TVC:GOLD (Gold)
Compares the prices of copper and gold, often used as a barometer for global economic activity.
Features:
Normalized Indicators: Each indicator is normalized to a 0-100 scale to facilitate direct comparison, regardless of their original units or scales.
Normalized Average Line: Calculates and plots the average of all available normalized indicators, providing a single line that represents the combined economic signals.
Customizable Display:
Show Individual Indicators: Option to display individual normalized indicators for detailed analysis.
Show Normalized Average Line: Option to display the normalized average line for a consolidated view.
Dynamic Labeling: Displays the latest value of the normalized average directly on the chart for quick reference.
How to Use:
Adding the Script:
Apply the script to a chart in TradingView using a timeframe that aligns with the frequency of the economic data (daily or weekly recommended).
Customization:
Show Normalized Average Line: Enabled by default to display the combined indicator.
Show Individual Indicators: Enable this option in the script settings to display all individual normalized indicators.
Interpretation:
Normalized Scale (0-100): Higher values generally indicate stronger economic conditions, while lower values may suggest weakening conditions.
Trend Analysis: Use the normalized average line to identify trends and potential turning points in the business cycle.
Notes:
Data Availability: Ensure you have access to all the data sources used in the script. Some data feeds may require specific TradingView subscriptions.
Indicator Limitations: Economic indicators are subject to revisions and may not reflect real-time market conditions.
No Investment Advice: This script is a tool for analysis and should not be considered as financial advice. Always conduct your own research before making investment decisions.
Advanced Volume-Driven Breakout SignalsThe "Advanced Volume-Driven Breakout Signals" indicator is a cutting-edge tool designed to help traders identify high-potential trading opportunities through sophisticated volume analysis techniques. This indicator integrates volume flow analysis, moving averages, and Relative Volume (RVOL) to provide a comprehensive view of market conditions, going beyond traditional Volume Spread Analysis (VSA) methods.
Key Features:
Volume Flow Analysis: Distinguishes bullish and bearish volume flows with distinct colors, making it easier to visualize market sentiment and potential breakout points.
Volume Flow Moving Averages: Calculates moving averages for volume using various methods (SMA, EMA, WMA, HMA, VWMA), accommodating different trading strategies. This includes settings for adjusting the type of moving average and its period, as well as thresholds for high, medium, and low volume levels.
Volume Spikes Detection: Identifies significant volume spikes based on user-defined multipliers and moving averages, highlighting unusual trading activity.
Volume MA Cloud Settings: Computes general moving averages of volume to track trends and detect deviations. This feature includes options to select different moving average types and adjust thresholds for detecting high volume activity.
Relative Volume (RVOL): Measures current volume relative to historical averages, triggering signals when RVOL exceeds predefined thresholds, indicating notable changes in trading activity.
Entry Conditions: Provides clear long and short entry signals based on combined volume flow conditions and RVOL, offering actionable trading opportunities.
Volume Visualization:
— Bullish Volume Flow: Light and dark green bars indicate bullish volume flow.
— Bearish Volume Flow: Light and dark red bars denote bearish volume flow.
— High Volume Bars: Highlighted in yellow, and extreme volume bars in orange for additional context. These bars are plotted for visual aid and do not directly influence trade signals, focusing instead on the quality and strength of the volume flow.
Alerts: Allows users to create alert notifications for long and short entry signals when the criteria are met, enabling traders to respond promptly to trading opportunities.
Usage:
Overlay: Apply the indicator directly to your price chart to visualise real-time signals and volume conditions.
Customisable: Adjust settings for moving averages, RVOL, and other parameters to match your trading strategy and preferences.
Comparison to VSA Scripts: The "Advanced Volume-Driven Breakout Signals" indicator extends beyond traditional VSA scripts by incorporating a wider range of analytical features. While VSA primarily focuses on volume spread patterns and price action, this indicator offers enhanced functionality with advanced RVOL metrics, customizable moving averages, and detailed volume spike detection, making it a more versatile tool for identifying breakout opportunities and managing trades. It is particularly effective when used alongside key levels and order blocks.
Acknowledgements: Special thanks to @oh92 and @goofoffgoose for their invaluable scripts, which served as inspiration in the development of this advanced trading indicator.
Notes: The script is continually evolving, with ongoing refinements aimed at enhancing accuracy and performance.

Black-Scholes option price model & delta hedge strategyBlack-Scholes Option Pricing Model Strategy
The strategy is based on the Black-Scholes option pricing model and allows the calculation of option prices, various option metrics (the Greeks), and the creation of synthetic positions through delta hedging.
ATTENTION!
Trading derivative financial instruments involves high risks. The author of the strategy is not responsible for your financial results! The strategy is not self-sufficient for generating profit! It is created exclusively for constructing a synthetic derivative financial instrument. Also, there might be errors in the script, so use it at your own risk! I would appreciate it if you point out any mistakes in the comments! I would be even more grateful if you send the corrected code!
Application Scope
This strategy can be used for delta hedging short positions in sold options. For example, suppose you sold a call option on Bitcoin on the Deribit exchange with a strike price of $60,000 and an expiration date of September 27, 2024. Using this script, you can create a delta hedge to protect against the risk of loss in the option position if the price of Bitcoin rises.
Another example: Suppose you use staking of altcoins in your strategies, for which options are not available. By using this strategy, you can hedge the risk of a price drop (Put option). In this case, you won't lose money if the underlying asset price increases, unlike with a short futures position.
Another example: You received an airdrop, but your tokens will not be fully unlocked soon. Using this script, you can fully hedge your position and preserve their dollar value by the time the tokens are fully unlocked. And you won't fear the underlying asset price increasing, as the loss in the event of a price rise is limited to the option premium you will pay if you rebalance the portfolio.
Of course, this script can also be used for simple directional trading of momentum and mean reversion strategies!
Key Features and Input Parameters
1. Option settings:
- Style of option: "European vanilla", "Binary", "Asian geometric".
- Type of option: "Call" (bet on the rise) or "Put" (bet on the fall).
- Strike price: the option contract price.
- Expiration: the expiry date and time of the option contract.
2. Market statistic settings:
- Type of price source: open, high, low, close, hl2, hlc3, ohlc4, hlcc4 (using hl2, hlc3, ohlc4, hlcc4 allows smoothing the price in more volatile series).
- Risk-free return symbol: the risk-free rate for the market where the underlying asset is traded. For the cryptocurrency market, the return on the funding rate arbitrage strategy is accepted (a special function is written for its calculation based on the Premium Price).
- Volatility calculation model: realized (standard deviation over a moving period), implied (e.g., DVOL or VIX), or custom (you can specify a specific number in the field below). For the cryptocurrency market, the calculation of implied volatility is implemented based on the product of the realized volatility ratio of the considered asset and Bitcoin to the Bitcoin implied volatility index.
- User implied volatility: fixed implied volatility (used if "Custom" is selected in the "Volatility Calculation Method").
3. Display settings:
- Choose metric: what to display on the indicator scale – the price of the underlying asset, the option price, volatility, or Greeks (all are available).
- Measure: bps (basis points), percent. This parameter allows choosing the unit of measurement for the displayed metric (for all except the Greeks).
4. Trading settings:
- Hedge model: None (do not trade, default), Simple (just open a position for the full volume when the strike price is crossed), Synthetic option (creating a synthetic option based on the Black-Scholes model).
- Position side: Long, Short.
- Position size: the number of units of the underlying asset needed to create the option.
- Strategy start time: the moment in time after which the strategy will start working to create a synthetic option.
- Delta hedge interval: the interval in minutes for rebalancing the portfolio. For example, a value of 5 corresponds to rebalancing the portfolio every 5 minutes.
Post scriptum
My strategy based on the SegaRKO model. Many thanks to the author! Unfortunately, I don't have enough reputation points to include a link to the author in the description. You can find the original model via the link in the code, as well as through the search indicators on the charts by entering the name: "Black-Scholes Option Pricing Model". I have significantly improved the model: the calculation of volatility, risk-free rate and time value of the option have been reworked. The code performance has also been significantly optimized. And the most significant change is the execution, with which you can now trade using this script.